

A Simple Automated Web Mapping System: Combining Data Collection and Mapping
My previous article discussed the collection of non-spatial data. I’ll now introduce the concepts of collecting spatial data alongside it and making it automatically accessible through web maps.
The Plan
Hundreds, if not thousands, of field-based observations can be collected in a single scientific field program. When there is a need to quickly visualize these observations spatially, the modern approach is to make that data available on a web map.
Most scientific maps are still static – that is, the task of producing them is still required. Web maps, on the other hand, are designed to be a living entity that reflect changes to the underlying datasets at the time they occur. This removes the ‘task’ of reproducing a map when changes in the data emerge. A real benefit of web maps then, and the subject of this article, is to combine the data collection effort with the ‘task’ of reproducing a map.
The Data
Scientists collect a lot of non-spatial data. Much of it eventually needs to be seen on a map, and so it makes sense to simultaneously capture spatial data alongside it; the coordinates of each observation. Spatial data acts as the bridge between these observations and the real world. This is because spatial data is always referenced to a coordinate system, and coordinate systems are referenced to the real world. This can be visualized as a series of connections:
![]()
Here’s an example: in a table of fish capture efforts (information on how an aquatic biologist tried to catch fish), coordinates are captured alongside this information to record the locations of said effort. Each fish capture effort observation has unique coordinates. These coordinates are referenced to the coordinate system, and the coordinate system is referenced to the real world. Simply put, these are the coordinates where the biologist was fishing.

Figure 1: collecting coordinates alongside non-spatial data
Let us briefly consider the difference between spatial data and non-spatial data: where you can instantly gain an impression from the length of a fish in centimetres, you can’t instantly gain an impression of where something is by reading two coordinates. You need a map to do that. The solution then, is to provide a system that will allow you to visualize point coordinates that is commensurate in speed to reading a fish length measurement.
The Solution
ESRI’s ArcGIS Enterprise allows organizations to house their own data (on their own servers) and publish it onto the web for viewing through ESRI’s online mapping technology. An organization will need a web server, an enterprise database (like Microsoft SQL Server), and have purchased and installed ArcGIS Enterprise.1 They will also need a mobile form collection application for storing data in the database (as mentioned in my first article, we use Flowfinity). These components constitute the technology required for an automated web mapping system.
This technology accommodates a means of viewing the data, but simply viewing the data is not the primary challenge. The challenge is to streamline the mapping of observations – remember, the goal is to combine the task of reproducing a map with the task of collecting data.
Instead of an iterative sequence of tasks, we can design the web mapping system to handle newly submitted observations (or edit existing ones) to automatically populate in a web map. This still calls for the same tasks involved in an ‘iterative’ approach, but only once!
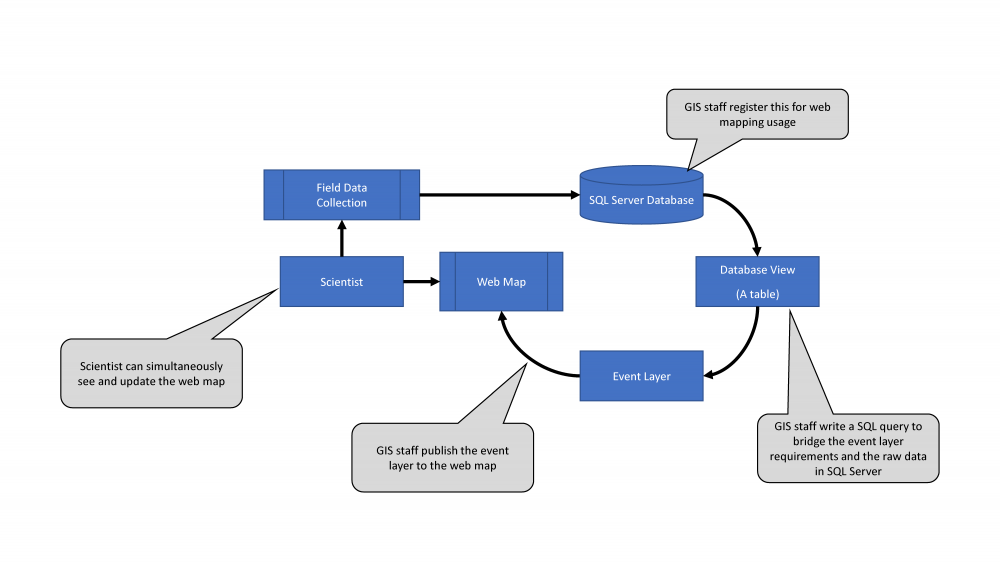
Figure 2: an automated mapping system
The key component of this design is the ‘Event Layer’. This is a type of ESRI layer that plots points based on coordinates from a table. It can be published in a web map and maintain its functionality; therefore, when you change or create something on your form, you change it on the map. The map is always talking to the database, and so is the form. So, when you update or add an observation, you’re not only updating your table, you’re updating your map.
Considerations
It’s probably accurate to say that there is a gradient of invested time and money that is proportional to the functionality that is required. The example presented in this article requires simple functionality, and therefore the investment of time and money is equivalent to producing a one-off map. More complex functionality would require a greater investment of time and money.
This solution is driven by three concurrent needs: 1) visualizing the spatial distribution of the non-spatial data, 2) the ongoing assessment of non-spatial data, and 3) the rapid comparison of one observation to another based on geography. If these are the needs of a project, then the web mapping solution outlined in this is paper is the quality and cost-effective choice. It allows a scientist to informatively perform their science while eradicating the task of reproducing maps.
If these aren’t the needs of a project, then the data collection platform will suffice. That was the case with the project this paper is based on – the web map was not needed. Despite having 208 fish capture efforts and 922 captured fish observations, the associated ‘site name’ for fish capture efforts and captured fish observations was enough for the project scientists to understand their data spatially. In other words, they didn’t need to visualize and cross-reference their observations spatially (#1 and #3 above). Perhaps they needed to do one or the other, but not at the same time.
This brings me to a sticking point: sometimes field data doesn’t need to be visualized spatially while working in the field. Sometimes a description will do just fine in the field, and the maps can be made later. This still requires simultaneous coordinate capture, but not a live web map. This results in iterative, task-based mapping procedures as the project progresses. But so long as the scientist is not hindered, and costs are not exacerbated, it may be the optimal procedure.
Conclusion
Spatial data differs from non-spatial data in that it is difficult to interpret without a map. It would seem necessary, then, to make non-spatial data accessible through a map. The task of producing a digital map is iterative and can be cumbersome, especially when reproducibility is necessary. A web map addresses these points because it requires a one-time setup. If a scientist needs to simultaneously visualize, compare, and assess non-spatial data across geography, a web mapping solution integrated with data collection is a viable solution.
1This is hardly a small investment of time, knowledge, and finances. There are many technologies in the geospatial industry capable of providing a similar service. Hemmera (my employer) is a forward-thinking organization committed to technical excellence and innovation, and therefore to the upfront costs of this enterprise solution. Many organizations, big and small, can find uses for alternative solutions for many good reasons


