

Canadian Geospatial Briefing May 10th: Developing Tools to Protect Canada’s Biodiversity; Tracking impact of industrial projects on B.C. species at risk; 3D satellite mapping shows that glaciers are melting faster than ever; Geospatial Maturity Index shows that Calgary is a leader in GIS programs; Community engagement to measure impact of climate change on coastal environments in the Estuary and Gulf of St Lawrence; Surprising locations in Canada that have seen the largest increase in house prices
Carleton and Partners Developing Tools to Protect Canada’s Biodiversity
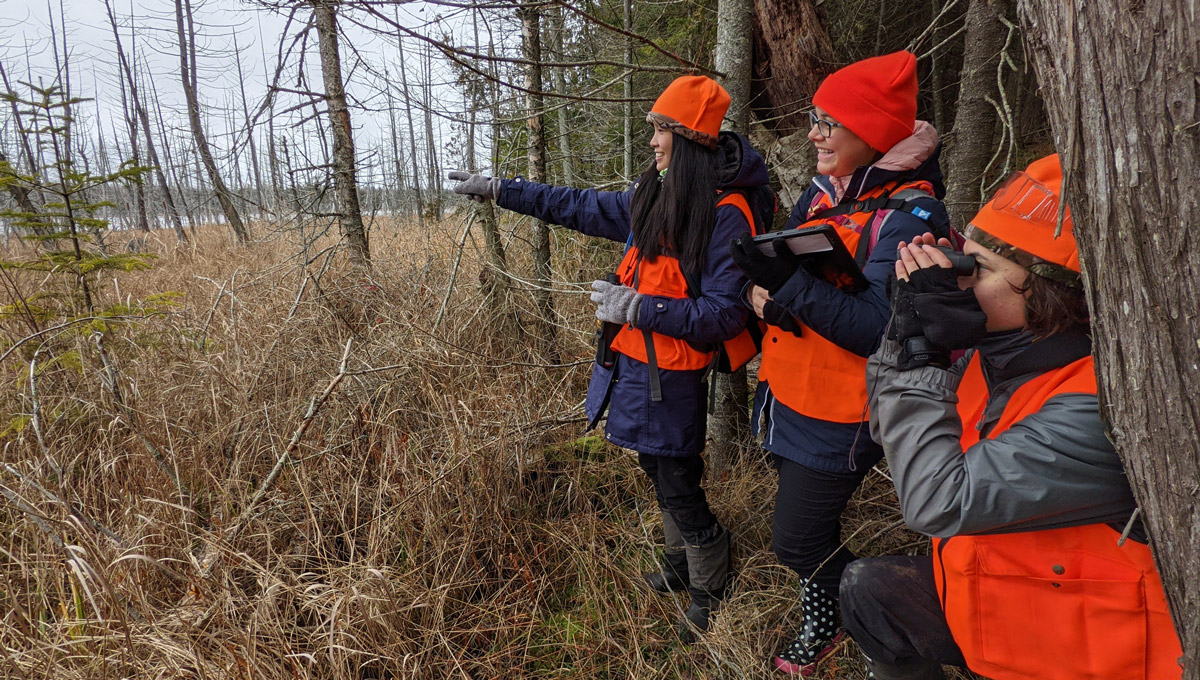
Dr. Joseph Bennett, a biology professor at Carleton University and his team will develop support tools that will assist partner organizations with prioritizing resources to help with ecosystem conservation across Canada. The tools in this project will be created through artificial intelligence, computational science and conservation planning approaches that are systematic. This five-year project will receive funding from the Natural Sciences and Engineering Research Council of Canada (NSERC) for an amount of $966,000 and from Environment and Climate Change Canada (ECCC) and the Nature Conservancy of Canada (NCC) for a cash amount of $483,000 and an in-kind amount of $853,500.
Article can be viewed here.
Interactive mapping tool tracks impact of industrial projects on B.C. species at risk
The Wilderness Committee BC has created an interactive map that highlights how government enabled industries have led to destruction of habitat. The Wilderness Committee BC illustrates that there are 1,680 species at risk in British Columbia as a result of these government enabled industries. The interactive map displays many regions where this is occurring, which include, spotted owls experiencing habitat destruction due to logging in Spuzzum Valley, migratory bird and chinook salmon experiencing habitat degradation due to container shipping projects in Delta, southern mountain caribou experiencing habitat destruction due to logging in Wells Gray, southern resident killer whales experiencing habitat disturbance due to Tran Mountain Pipeline ship traffic in the Salish Sea and 60 different species experiencing habitat degradation and destruction at the site C dam in Peace Valley.

Article can be viewed here.
Satellite mapping: Glaciers melting faster than ever
An international study was released showing how 3D satellite mapping can be used to show the extent of glacier mass loss over the past few years. This study compared the time period of 2000-2004 against the time period of 2015-2019 and found that during the recent period glaciers were losing 78 billion tons more per year of mass than during the previous period. This study looked at 220,000 glaciers from around the world and determined mass loss by creating elevation models using 440,000 ASTER satellite images, they discovered that out of all of the glaciers they studied, the glaciers found in Alaska and Canada had experienced the largest glacier loss.

Article can be viewed here.
Measuring Public Sector Geospatial Program Maturity
The Geospatial Maturity Index was designed to assist public sector organizations evaluate their own GIS departments and program maturity to that of their peers. This survey evaluated 90 public sector organizations from the United States, Canada, and Australia and measured readiness, implementation, and impact. Two Canadian cities, Calgary, and North Vancouver were among the top three Top-Performing GIS Programs of 2020.

Article can be viewed here.
Participatory Geomatics Network for Coastal Mapping and Monitoring
Recent technological advances in the applied geomatics field such as, open-sourced photogrammetry algorithms and low-cost precise positioning devices allow folks who are not specialists in the field of geomatics, acquire data. These low-cost devices allow individuals to monitor shorelines for any changes that may have occurred due to climate change. This project, funded by the Québec Maritime Network (RQM) is using this technology to monitor the coastal environment of the Estuary and Gulf of St Lawrence. The project will create a community-based participatory approach to collect data and use that data to better monitor coastal environments that are more susceptible to the impacts of climate change.

Article can be viewed here.
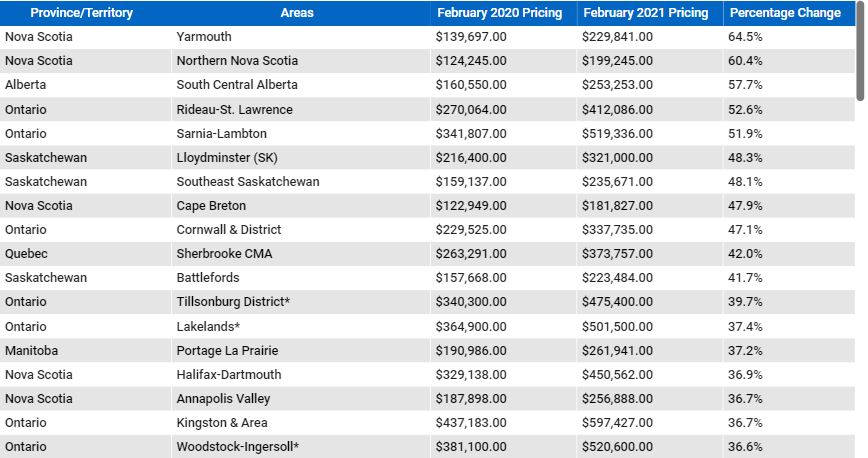
Where in Canada are house prices increasing the most? Maybe not where you think
House prices are on the rise in Canada, however, the locations that have seen the largest increase may surprise you. During the past year we have seen that more individuals are working from home, and as a result, more individuals are trading smaller centrally located homes for larger suburban homes. This change has caused house prices in more rural regions to increase by as much as 60% in some areas. Regions such as Yarmouth, Northern Nova Scotia, and South Central Alberta noted the largest increase.
Article can be viewed here.


