
Detecting Land Deformation Related to Hydraulic Fracturing
Fracking in North America
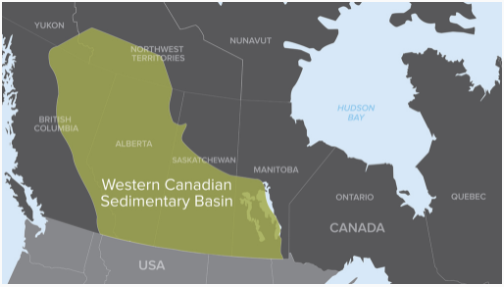
The link between hydraulic fracturing, or fracking, and earthquakes has been well-established in studies throughout North America. An increase in pore-fluid pressure and/or a change in the state of stress may cause reactivation of existing faults and fractures. A 2016 study found that the 5 years of accelerated oilfield fluid injection at sites across the Western Canadian Sedimentary Basin has led to a sharp increase in the rates of earthquakes over 3.0 Moment Magnitude (Atkinson et al, 2016). More recently, a 2020 report written by Enlighten Geoscience Ltd used a principal component analysis (PCA) reduction technique to determine relevant parameters behind correlations between fracking operations and earthquakes (Fox et al, 2020). Areas previously seismically inactive have begun experiencing quakes local in time and space to fracking sites.
While the majority of these quakes are not dangerous, larger earthquakes can trigger landslides and threaten nearby infrastructure. Wave propagation hazards, caused by ground shaking, and permanent ground deformation following earthquakes can seriously damage underground pipes (Karamanos et al, 2014). High-risk areas, characterized as the intersection of infrastructure and vulnerable zones, need to be efficiently delineated so effective precautions can be placed. This article explores the use of open-source data and software to detect ground deformation, determine statistical significance, and define the affected areas.
Fort St. John, November 2018
November 29, 2018, Fort St. John earthquake was a relatively high magnitude quake for which the cause is suspected to be nearby injection wells. According to the U.S. Geological Survey, the quake had a preliminary magnitude of 4.2, and the epicentre was 22.4 km southeast of Fort St. John (Wagstaffe, 2018). While there were no reports of damage, nearby residents certainly felt the quake, most likely due to its relatively shallow depth.
The Experiment
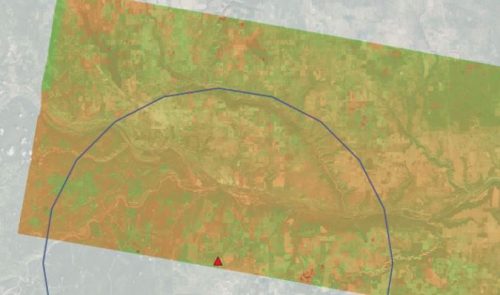
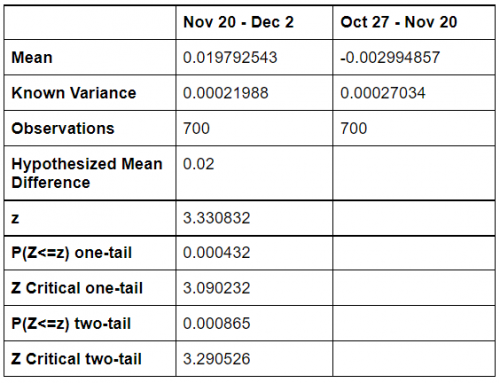
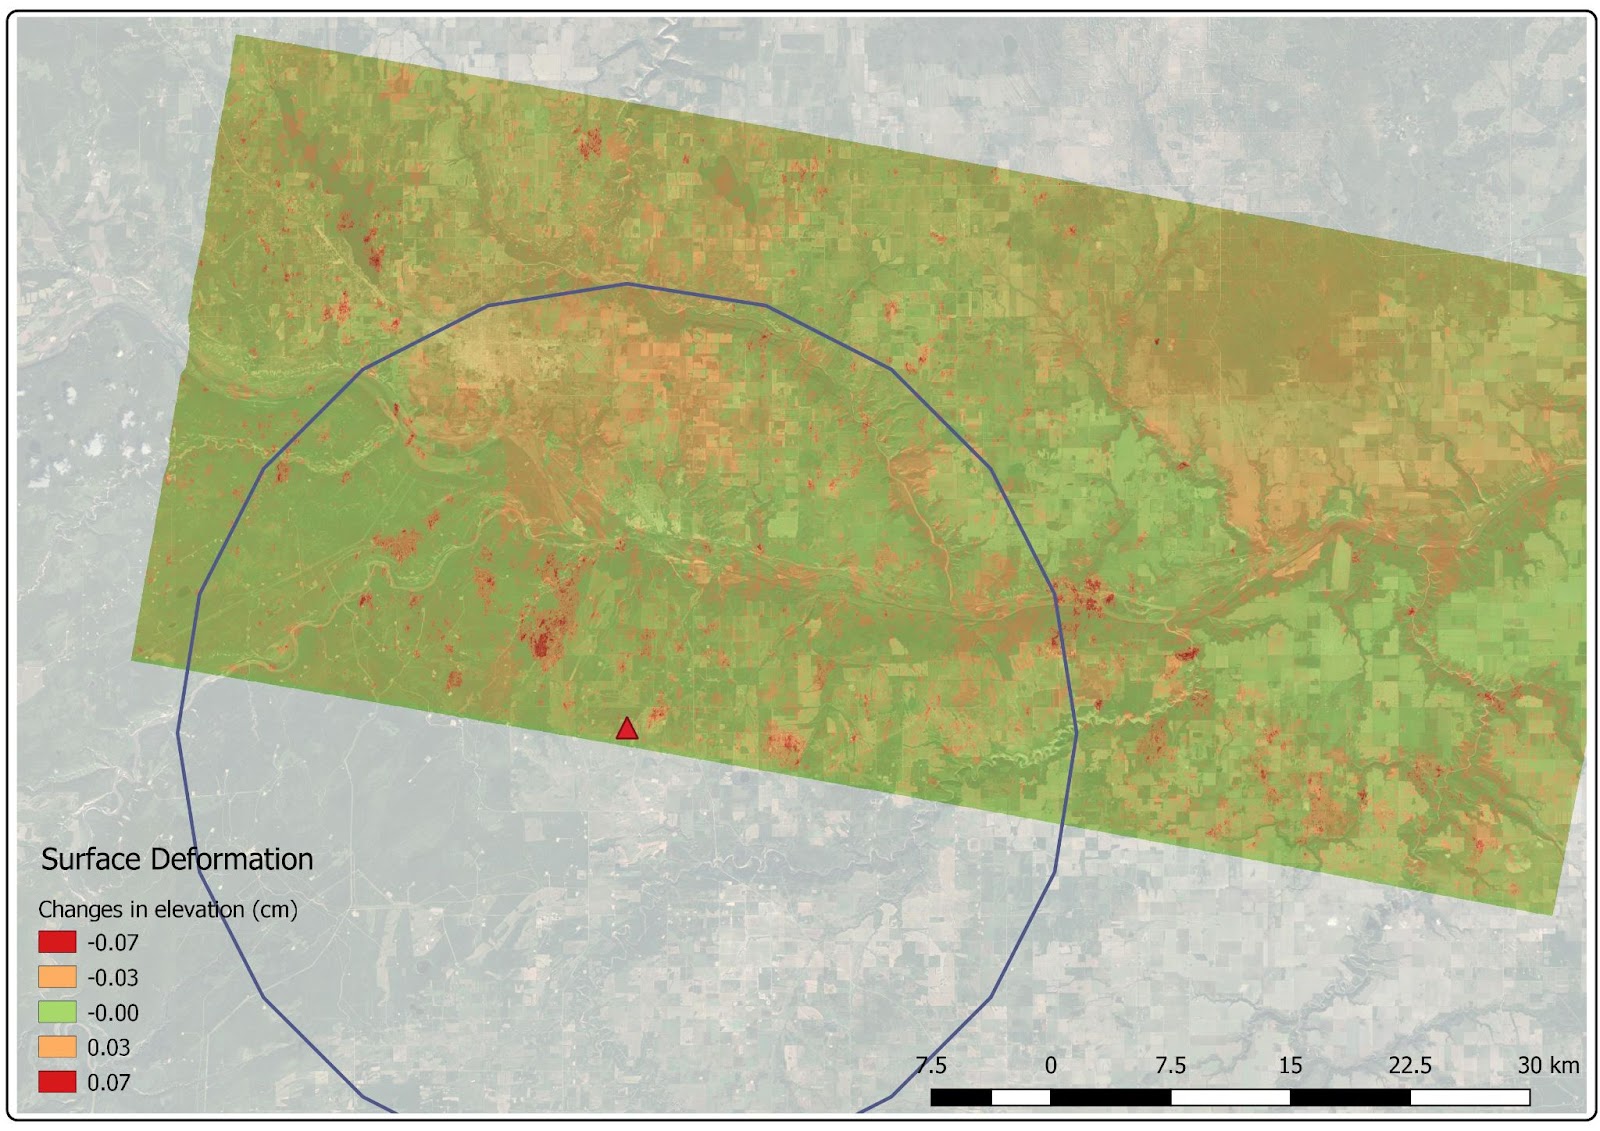
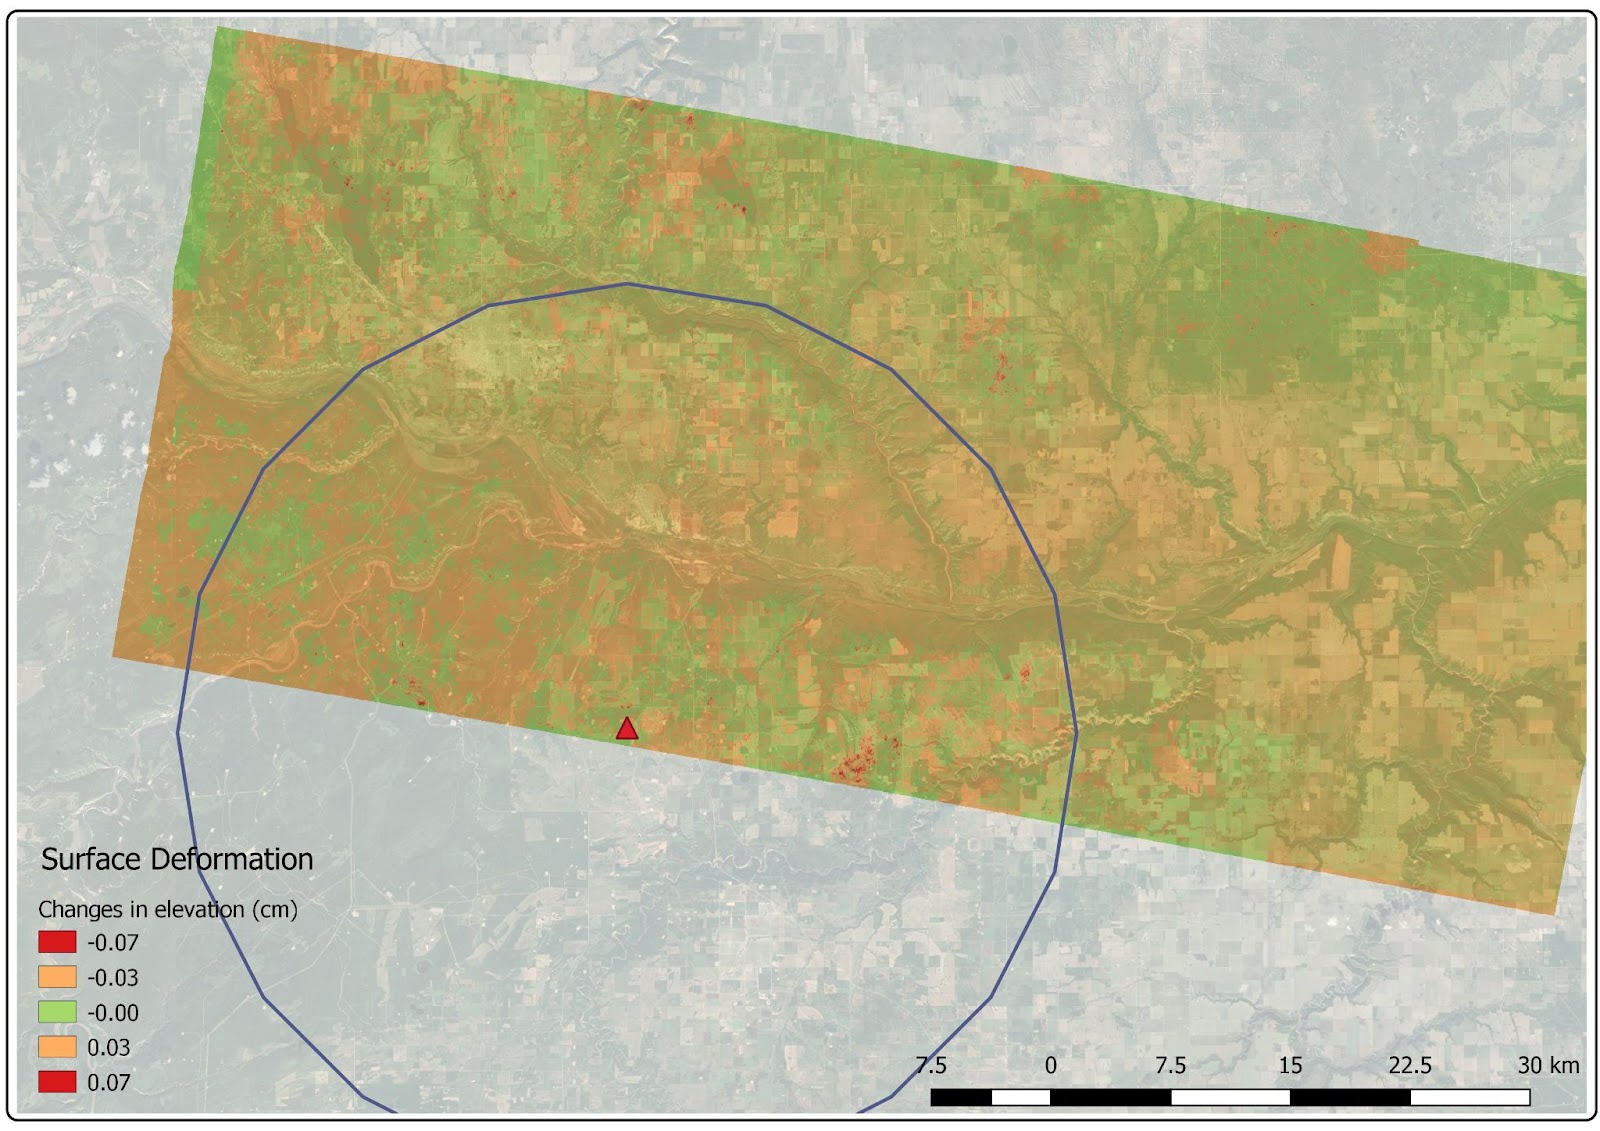
Sentinel-1 data was obtained from the Copernicus Open Access Hub. The ESA SNAP platform was used to process the phase data into geolocated interferograms, which infer the height of scatterers within the images. The pre-event interferogram captured the phase difference between October 27 and November 20; the post-event interferogram captured the phase difference between November 20 and December 7. Random sample points were generated over the interferograms; 700 data points were selected within a 25km radius of the epicentre and used in a z-test of statistical significance.
Conclusions
The z-test rejected the null hypothesis; the difference in means is statistically significant beyond a hypothesized mean of 0.02cm. This experiment suggests the changes in elevation after the earthquake can not be reliably attributed to random chance. The interferograms, however, fail to effectively delineate a clear affected area: there are more widespread levels of low deformation rates throughout the study area, but no discernable zones of drastic deformation.
These study methods need further information to come to a concrete conclusion. The inclusion of coherence values, vegetation, slope, and geologic information would greatly improve the experiment. GPS coordinates could provide accurate reference points, and additional Sentinel-1 datasets would establish an annual average rate of movement. Fundamentally, a more precise radar instrument, used over a longer period of time, would provide a more adequate understanding of the earthquake’s effects on the surrounding area.
Citations
Atkinson, Gail M., et al. “Hydraulic Fracturing and Seismicity in the Western Canada Sedimentary Basin.” Www.desmog.com/, Seismological Research Letters, 2016, https://www.desmog.com/wp-content/uploads/files/Hydraulic%20Fracturing%20and%20Seismicity%20in%20the%20Western%20Canada%20Sedimentary%20Basin.pdf.
Fox, Amy, et al. “Statistical Assessment of Operational Risks for Induced Seismicity from Hydraulic Fracturing in the Montney, Northeast BC.” Www.geosciencebc.com/, Enlighten Geoscience Ltd., Oct. 2020, http://www.geosciencebc.com/i/project_data/GBCReport2020-12/Geoscience%20BC%20Report%202020-12%20FINAL%20REPORT.pdf.
Karamanos, Spyros A., et al. “Seismic Design of Buried Steel Water Pipelines.” /Www.nwpipe.com, ASCE, 2014, https://www.nwpipe.com/app/uploads/2020/08/Seismic-Design-of-buried-water-pipeline-Spyros-ASCE-2014.pdf.
Wagstaffe, Johanna. “4.5-Magnitude Earthquake Strikes Northern B.C. | CBC News.” CBCnews, CBC/Radio Canada, 30 Nov. 2018, https://www.cbc.ca/news/canada/british-columbia/4-5-magnitude-earthquake-strikes-near-fort-st-john-1.4926772.
Weber, Bob. “Study Suggests Bedrock Stress – a Factor in Fracking – Caused Earthquakes | CBC News.” CBCnews, CBC/Radio Canada, 29 Oct. 2018, https://www.cbc.ca/news/canada/edmonton/research-fracking-earthquakes-geological-survey-canada-1.4883035.