Geomatics Web Services Used in Recent Quebec Floods
Editors note: This article has been jointly written by Nicolas Gignac and Serge Legaré from the Ministry of Public Safety in Quebec.
Cet article est aussi disponible en français : http://www.quebecgeographique.gouv.qc.ca/approfondir/bibliotheque/geoinfo/geoinfo-juillet-2017.asp
During Spring 2017, a major flood occurred in Eastern Canada, centered around south west Quebec. This flood was created by abundant rainfall lasting two months in the melting season. It was among the most severe flood since 1974. It impacted heavily populated areas of southern Quebec near Montreal and Gatineau. Hundreds of square kilometers of flooded areas have exceeded the 100-year record.

2017-04-01 Abundant rainfall warnings and precipitation in real time (GeoMet Web Service Weather Radar) issued by Environment Canada.
Rainfall tends to last for weeks in Eastern Canada as snow melts in the northern area, as early as the beginning of April. Public Safety Quebec Emergency Operational Center (PSQ-EOC) monitors the situation closely 24/7 by coordinating assistance with its partners in all regions of Quebec. As flows started rising at the end of April, the Quebec government decided to move its PSQ-EOC from Quebec City to Montreal to be closer to the affected area. The flow peaked on May 8th. The situation needed good coordination and planning as experts, emergency teams and army were mobilized on the ground to assist citizens and municipal manager.

© [2017] Airbus Defense and Space, License by Planet Labs Geomatics Corp., www.blackbridge.com/geomatics
Here is a summary of statistics for this unusual flood in southern Quebec:
-
Active operations of PSQ-EOC lasted from April 5th to June 5th
-
23 conference calls were held between May 5th and 19th
-
78 reports were published by PSQ-EOC to follow up and inform partners during operations
-
1,500+ employees were mobilized in various Government of Quebec departments and agencies
-
261 municipalities were affected; State of Emergency was declared in 22; 170+ used the provincial financial assistance program
-
5,371 residences were flooded
-
4,066 people were evacuated
-
~550 roads were damaged
-
3 deaths took place
-
2,600 Canadian military personnel were engaged in operations
-
As at June 2, $13,581,663 were paid through the Quebec’s Specific Financial Assistance Program for Floods
Get a clear picture and accessible to everyone: key elements
It was important to closely monitor the situation especially meteorological events; hydrological impacts; past, present and future flood areas; affected municipalities; status of road network and level of flows. Related information was requested to assist emergency managers working in this wide and densely populated region. Consequently, PSQ-EOC and its partners had to demand, access, purchase, integrate and publish various geomatics products to support decision making. During this event, one of the mandates of PSQ-EOC operations was to coordinate all those geomatics operations. In such a major disaster, various organisations, journalists and citizens typically look for near real-time information. They usually search web maps to provide a quick overview as “a picture worth a thousand words “!
To reuse of web mapping products and minimize administrative barriers in this time-critical situation, the decision was made to openly offer all products through public URLs as standard Web OGC services. They included:
-
Web Map Service (WMS): for overlays with a clear symbology
-
Web Map Service Time (WMS-Time): for historical analysis for near real-time data
-
Web Feature Services (WFS): for raw open data to process and mapping
-
Web Map Tile Service (WMTS): for base maps
All these services were hosted in a solid Open GIS Infrastructure, called IGO (Open Geomatics Infrastructure: www.igouverte.org/english/). IGO was developed by the Quebec government over the years and hosted by Public Safety Quebec. Adding to this, there were also an easy-to-use interactive web mapping application adapted to mobile devices which universally depicted the evolution of the event using these web services.
Here are the main facts related to the high demand of these geomatics services during this period:
-
45 million web requests occurred just in May on geomatics Public Safety Quebec Web GIS servers
-
A maximum of 100 queries per second and 6-7 million queries per day occurred on May 7th and 8th, 2017 on these same servers
-
30+ satellite images products were shared and published (Radarsat-2, SPOT, Pleiades)
-
50+ map layers in OGC Web services (WMS, WFS) and in a web map application through regular browsers and mobile devices
-
Activation of the International Charter “Space and Major Disasters” in Eastern Canada on May 6th, 2017
-
Several requests were made for thematic mapping products and spatial analysis on flooded areas for different operational and administrative needs
Experimentation of a new NRCAN services
Usually, Public Safety Quebec requested radar imageries to monitor ice river conditions and mapped ice jamming with certain known high risk flood areas during the spring season, under its Radarsat-2 agreement with Public Safety Canada,. However, in April and May of this year, emergency events were more related to flood in open water situation, not the usual ice jam situation. Quebec Public Safety therefore had to adapt its processes and ask Natural Resources Canada (NRCan) Emergency Geomatics Services group (EGS) to test a new NRCAN algorithm image processing for the first time. This emergency service was developed in a near real-time event to map extent of floods in open water situation. This new algorithm for open water situation was recently developed by using high-resolution radar satellite images (e.g. 9m resolution). This was like the ones that were already ordered by Public Safety Quebec.
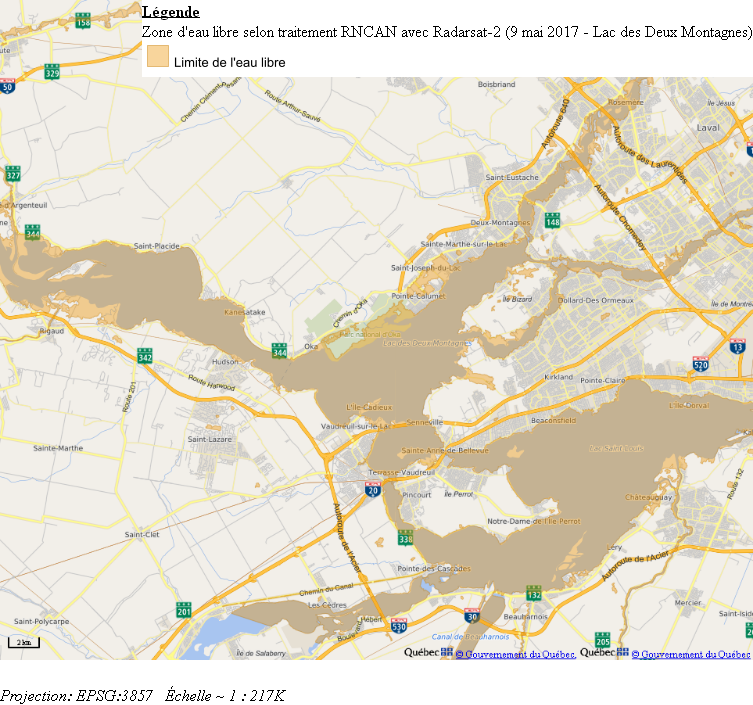
Map of polygon extent
Maximum extent polygons were then generated derived from a system operated by NRCan’s Strategic Policy and Results Sector (SPSR) using radar satellite imagery products (ex. Radarsat-2, TerraSar -X, Sentinel) from PSQ-EOC. These mapping products were then shared with partners and processed by SPSR for quick validation by PSQ-EOC. During the event, these products were distributed in near real-time, depending on imaging availability (approximately every three days for Radarsat-2). These polygons products represented the extent of water in urban and vegetated environment. It should be noted that the product was a near real-time interpretation of satellite data and was not fully validated during the emergency phase.
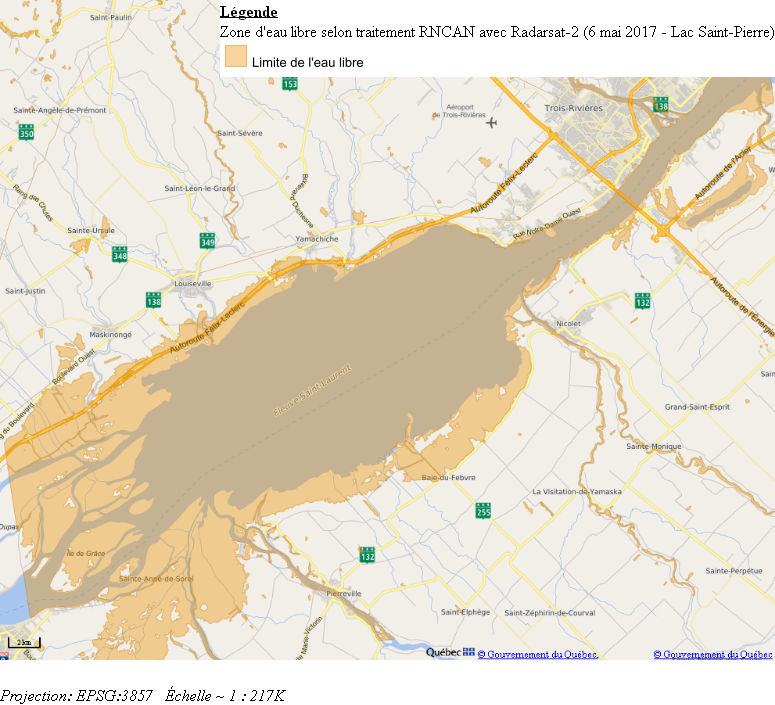
Second map of polygon extent
In order to monitor the evolution of the water level on the infrastructure more effectively and to map historical maximum of the flood, other satellite imageries in the visible and infrared spectrum (SPOT 1.5 m resolution and Pleiades resolution 50 cm) were also purchased and processed. These images were acquired in particular through PSQ-EOC with Ministry of Energy and Resource of Quebec in order to ensure coherence between public safety needs and various sensors available on the market. To facilitate the exchange of information between government and agencies, discussions were held real-time through an online collaborative platform. The acquired images were made available by the Government of Quebec a few hours after data capture to RNCAN for validation. Moreover, these images in the visible and infrared spectrum were made available later in the summer to the general public with the agreement made with the private operators of the satellites (Distribution Astrium Services, Airbus Defense and Space) a few weeks later by Web service and in the Open Data portal: Données Québec (www.donneesquebec.ca).
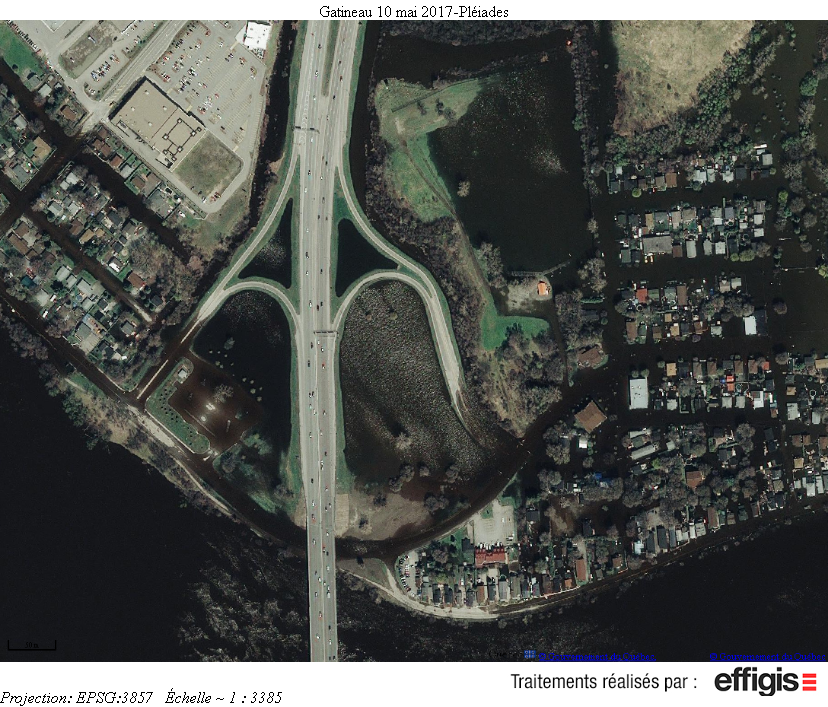
Includes equipment © CNES (2017), Distribution Astrium Services / Spot Image Corporation, USA, all rights reserved
PSQ-EOC also received the support from Transport Canada through its National Aerial Surveillance Program (NASP) to acquire oblique images for the impacted areas. Two aircrafts from Transport Canada, the Moncton-based Dash-8 and the Ottawa-based Dash-7, flew over flooded areas from May 7th to 16th and acquired more than 14,000 oblique images. NRCan’s developed a standardised web-based service (WMS) shared with Public Safety Quebec to get an overview of these 14,000 oblique images acquired and integrated into their Web mapping applications. These oblique images were also used by NRCan to validate their polygons for the extent of open water in their process.
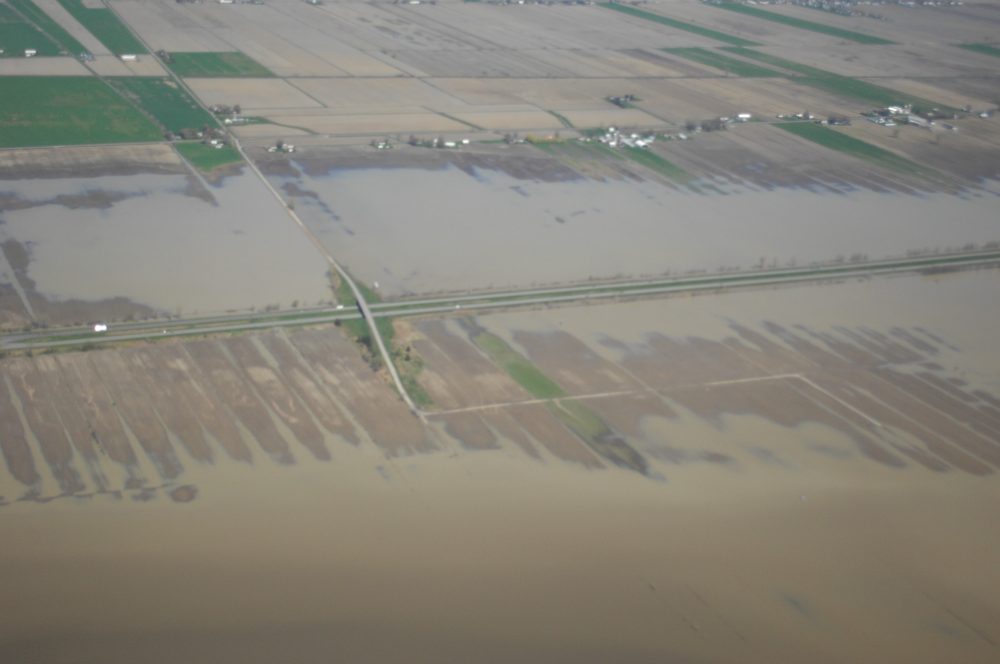
PNSA 2017-05-15 Lake Saint-Pierre at Highway 40
Here is a summary of the geomatics data used and made available to the general public:
-
Open Data in Open Format of affected areas by major floods April-May 2017 (https://www.donneesquebec.ca/recherche/fr/dataset/cartographie-des-inondations-majeures-avril-mai-2017)
-
NRCan Water Extension Polygons (https://www.arcgis.com/home/item.html?id=9f30ae69ec5a4c939479ce79ea7c4b7a)
-
Cumulative of affected municipalities (https://www.donneesquebec.ca/recherche/fr/dataset/cartographie-des-inondations-majeures-avril-mai-2017/resource/98fcf85b-ba3e-41c9-83be-a5ada8d1011e)
-
History of landslide events since April 1st 2017 to now (https://www.donneesquebec.ca/recherche/fr/dataset/cartographie-des-inondations-majeures-avril-mai-2017/resource/c6fb0569-b588-4167-becd-d533dc48f333)
-
History of flood events since April 23rd, 2017 to now (https://www.donneesquebec.ca/recherche/fr/dataset/cartographie-des-inondations-majeures-avril-mai-2017/resource/e657f2ab-82bc-49b8-9c94-6bda92555049)
-
Interactive map adapted to mobile device (IGO2) of the flood situation in Quebec (https://geoegl.msp.gouv.qc.ca/igo2/apercu-qc/?context=inondation)
-
-
Status of the flood in Quebec (http://www.securitepublique.gouv.qc.ca/securite-civile/aide-financiere-bonifiee-2017/cartes-inondations.html)
-
Environment Canada GeoMet Geospatial Web Services (https://www.ec.gc.ca/meteo-weather/default.asp?lang=Fr&n=C0D9B3D8-1)
-
Monitoring of flood waters (https://geoegl.msp.gouv.qc.ca/adnv2/)
-
Status of the Road Network – Quebec-511 (http://www.quebec511.info/fr/Carte/Default.aspx)
Future development and upcoming
Geomatics work will continue during the current recovery phase to more accurately determine the historical maximum flood by reusing NRCan’s polygons maximum extent and validating them with field operations to be made in the upcoming months. Discussions with OpenStreetMap community of mappers about their involvement will also take place.
Recently, Public Safety Quebec was also able to test a new web mapping application adapted for mobile devices and developed by the government (https://geoegl.msp.gouv.qc.ca/igo2/apercu-qc/?context=inondation). This solution called Open Geomatics Infrastructure version 2.0 on GitHub (IGO2: https://github.com/infra-geo-ouverte/igo2) was offered from a mobile device to easily track floods. IGO 2.0 is an open source GIS development project carried out in partnership with many organisations in Quebec. This solution follows the latest web trends (mobility, API searching tool, simplicity, offline tool) and geomatics (OGC web service, time analysis). It will be enhanced in the coming months with new features. This solution is based on other open source projects, such OpenLayers 4, Google Angular 4 and Google Material. For now, it has been made available to the public into the application gallery of Quebec’s Open Data Portal: Données Québec (www.donneesquebec.ca/fr/applications/). At the same time, another internal secure version of IGO2 for Public Safety organisations was successfully tested on mobile devices at the PSQ-EOC.

Web mapping application – IGO2.
An indication that GIS Web services or products were needed by citizen and the media was that much data and web GIS application were intensely used to inform the public. These geospatial data and maps available on the Web have been widely publicized by various media during this major events. These include (some only in French):
-
http://lactualite.com/societe/2017/06/05/monsieur-catastrophes/
- https://geoegl.msp.gouv.qc.ca/blogue/role-geomatique-msp-inondation-printemps-2017.html
GIS Web services has proven to be very useful by the media and popular to follow other disaster events this year, such as Forest Fire in British Columbia and Hurricane Harvey in Texas.