
In Rome: Bridging the Gap Between Archaeology and Geostatistics
Canadian Alan Armstrong returns us to Rome for this next article in his series on archaeology and GIS.
It’s been a few months longer than previously expected but I am back, and with results to show for it.
Where I last left off, I was discussing the geospatial archaeology work that I had started in Rome back in June, 2018, and where I believed it was going. Well, since then I can tell you that my work did not go in the exact direction as expected. However, I reached an end with geostatistical results that are quite interesting.
In returning to work in early September of last year, the month bore witness to my project hitting a wall with the use of principal component analysis (PCA) and transitioning into adopting principal coordinate analysis (PCoA). This change in process was due to PCA having limitations in accepting the datasets that I was using by not being able to recognize the 0’s from the archaeological finds data from Gabii. Even with the datasets being in proportional values, PCA’s algorithm does not allow for 0’s which PCoA in turn does, and thus I began using this process instead.
Over the following three months, the project progressed and experienced ups and downs, but finally proved fruitful by the mid-point of December. From the PCoA script that I wrote using RStudio, I was able to produce quantitative and qualitative results that portray the deposition of pottery types across a temporal period at the city of Gabii from two areas of excavation. As can be seen in the plot below, the x-axis represents centuries while the y-axis represents decades. Furthermore, the red characters are the different pottery type variables, and the black characters are the excavation zones across the two excavation areas. The cluster on the right is from the Archaic period (900BCE – 500BCE) of the city, with the central cluster belonging to the Republican period (500BCE – 27BCE), and the upper cluster being from the Middle Imperial (27BCE – 200CE). Through these results, I was able to trace the growth, peak, decline, and collapse of this section of Gabii which lines up with the historical literature on the site.
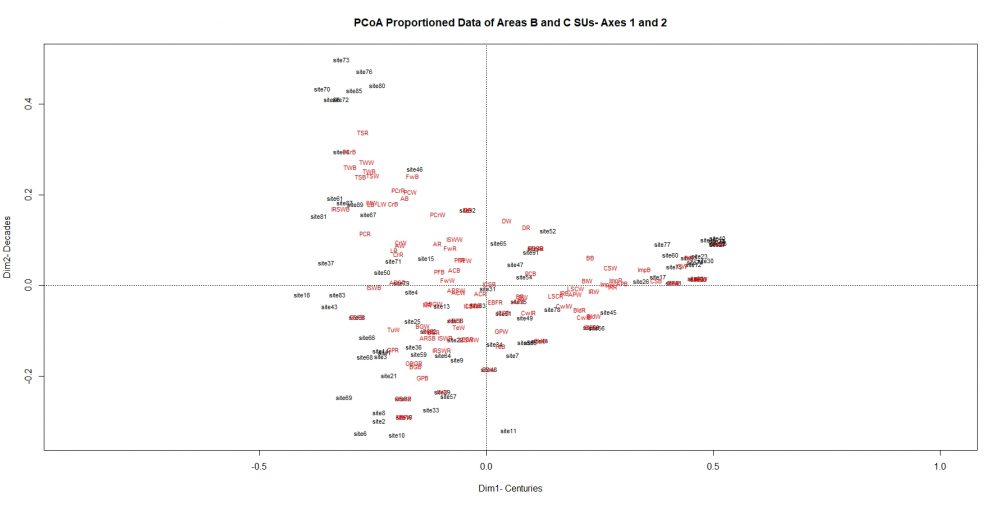
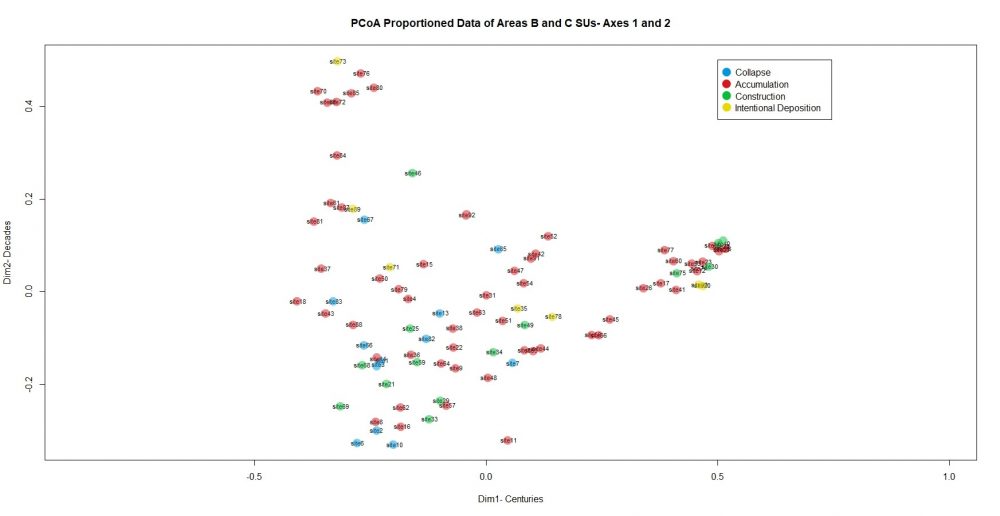
To dive deeper into the results, the second plot below portrays how the 92 excavation zones were formed at different stages in time that correlate with how the city developed and degressed. There were four formation processes found across the excavation zones where each represents how different forms of human activities led to the deposition of the pottery variables within the excavation zones. The statistical results from the PCoA and the different formation processes further represent when certain types of pottery types were in-use and then deposited for the last time before being excavated millennia later. From these relationships and correlations, trends and patterns are visible in both the quantitative and qualitative results.
With what was found during my work, geostatistical methods and processes for analyzing and interpreting the finds data from Gabii have proven successful and can be of further use in archaeology. The benefit of using PCoA for this was that it portrayed Euclidean distances between the excavation zones and pottery variables which is more suitable for this type of work based on the geographical differences and distances of the data. There are other statistical processes and methods that can be used for archaeological purposes which depends on the specific work being done. With the methodology of this project is constructed based on Mediterranean pottery finds and excavation processes, the use and application of PCoA and other geostatistical processes can be modified to be used on other datasets at other archaeological sites around the world. It truly is an exciting time for geostatistical archaeology, and only time will tell what new and varied projects come from this merging of the fields.
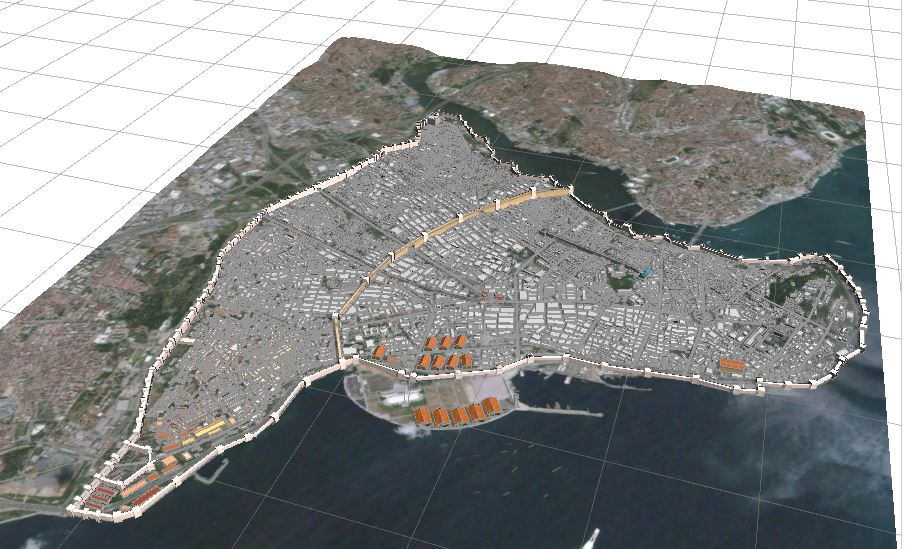
As for myself, this project has transitioned into an analysis and review stage for my professor/boss to determine where the work can go next. From here, I am pursuing other work and projects that not only combine archaeology and history with geostatistics and GIS, but other work in the wide-world of GIS as well. One of these such projects was my recent completion of the first stage of a 3D reconstruction of Constantinople circa 500CE. I am again using ESRI’s CityEngine for this project where my first time using this software was to build a 3D reconstruction of the ancient Syrian city of Palmyra circa 300CE. Through what I have done and still continue to do with my work in this field, I continue to strive to adapt geospatial capabilities with archaeology and history in order to preserve what is old with what is new.