
International Geospatial Briefing Jan 31st: 1. Exploring the World’s Food Sources; 2. Tracking Sinkholes with Satellites; 3. New Map Shows 2016 Methane Emissions Worldwide; 4. AI and McDonald’s Locations; 5. Satellites Proving Useful in Aftermath of Tonga Eruption
New Interactive Map Explores World’s Food Sources
A new application recently published by Visual Capitalist allows users to explore food production around the world like never before. The interactive map allows you to sort and explore incredible amounts of data, including both consumption and production metrics for an extremely wide variety of foods. The map can be sorted by country, time-lapse data is also available for many foods. In our opinion, the data is best explored in its’ visual format, but it can also be viewed in tabular form. This project is truly immense and an incredible collection of data so while the article touches on some staple crops and their roles in fighting worldwide food insecurity, we think you should really take some time to explore this application for yourself.
Explore the interactive application here.

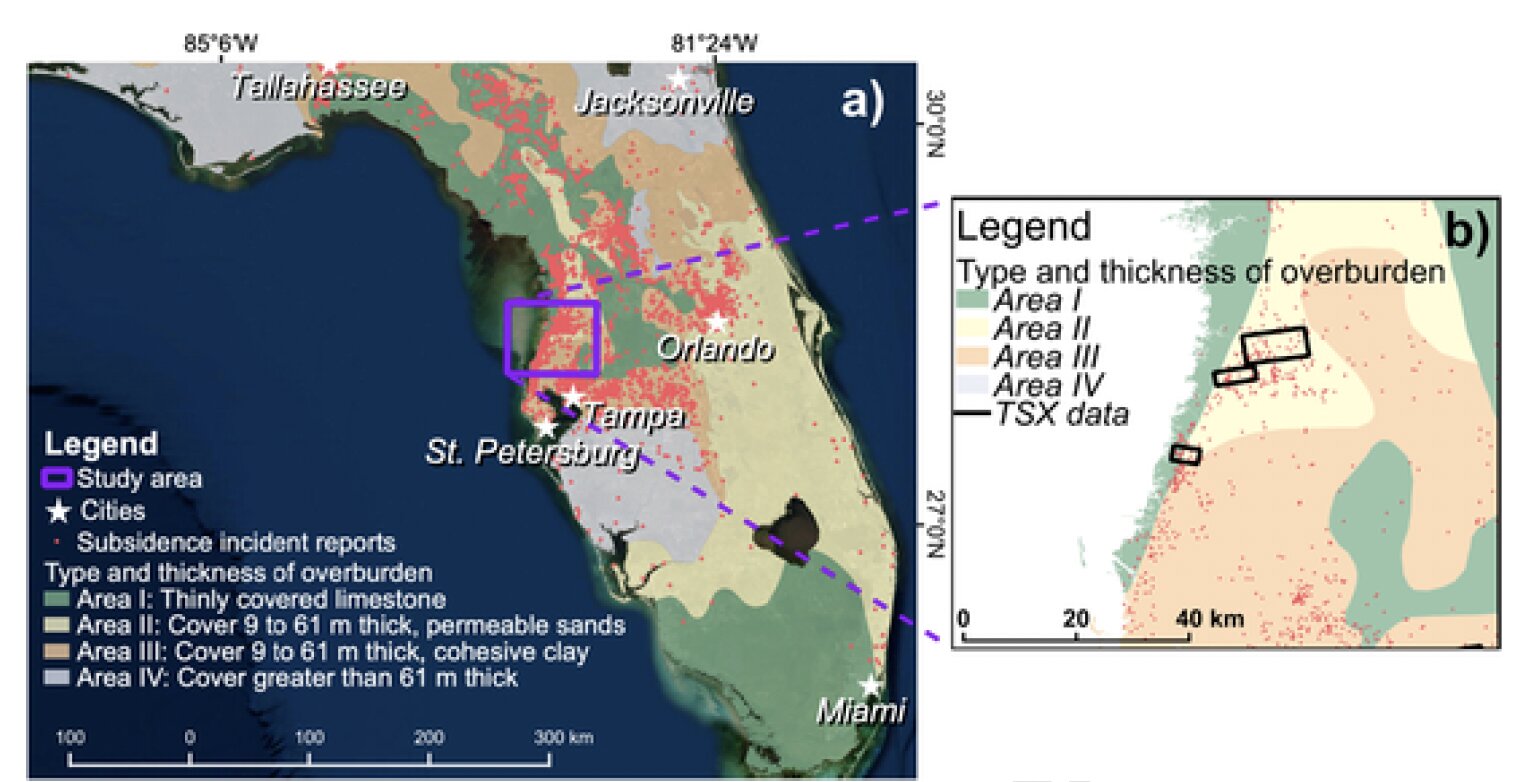
Tracking Sinkholes with Satellites
A joint team of Florida International University and the University of South Florida is expanding the applications of InSAR (Interferometric Synthetic Aperture Radar) with their latest project tackling sinkholes. Florida is well known for its karstic landscape that has led to a plethora of sinkholes in recent years, and the team led by geophysics professor Shimon Wdowinski is hoping to provide a new solution to monitor how these landscapes are changing, at millimetre-per- year accuracy. InSAR provides a level of detail that is not visible to the naked human eye, allowing for the pinpointing of locations with ground movements that would otherwise go unnoticed until it’s too late. Using InSAR observations the team can identify regions to be further targeted with ground-based instruments such as ground-penetrating radar that can provide a fuller picture of what is happening in the sand and soil below. With this added insight, the team hopes its methods can identify disasters before they happen and provide reliable data with life-saving implications.
Read the full story here.
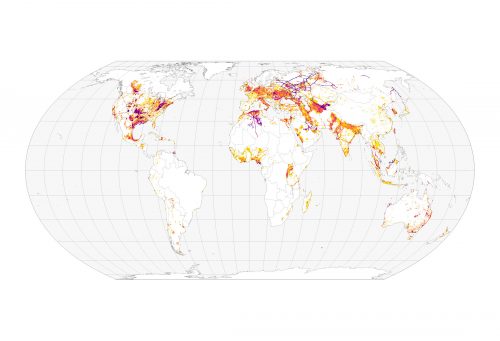
Visualizing Methane Emissions Across the Globe
NASA recently shared new maps of methane emissions worldwide from 2016 that allows the visualization of some of the world’s largest sources of emissions. Methane is one of the most potent greenhouse gases known to man, having up to 20x the warming effect of CO2 in the atmosphere. The map, seen below, identifies hotspots where emissions were the greatest throughout 2016 and can be interpreted to highlight some intriguing patterns. In Russia, for example, you can see the specific path of pipelines making their way to western Europe. Among the most notable observations, the emissions leaders were Russia for oil-related emissions, the U.S.A leads the way in natural gas emissions, and China leads the world in methane emissions from coal-related activities.
Read the full story here.

McDonald’s Germany Using AI for New Locations
McDonald’s Germany recently announced a new partnership with Targomo, a location intelligence start-up based in Berlin and Potsdam. Targomo uses AI to analyze geospatial data to unleash the potential of location intelligence for their customers. While this deal is specific to McDonald’s Germany and their expansion plans, company-wide the shift to modern technologies is something that McDonald’s attributes to their success through the pandemic, when many locations had their dining rooms closed around the world, adapting to changing conditions is something that helped them remain successful and profitable.
Read the full story here.
Satellites Providing Deeper Insights to Tonga Volcanic Eruption
With the growing number of satellites orbiting the planet, earth observation data is becoming more available and more frequently captured. The recent volcanic eruption near the South Pacific island of Tonga illustrated this, with many different satellites capturing the same event. An event of this magnitude was felt for hundreds of kilometres, but also widely captured from space. The article from the BBC has amalgamated some of the best data captured about the event, which strongly illustrates the wide variety of earth observation data and all the advantages it offers us in better understanding the natural systems of the planet. We highly recommend checking out some of the important data that was collected of the event, and the interpretations of the data that have quickly become available.
Read the full story here.
This shows data from all three weather satellites covering the area. From left to right: Korea’s GK-2A, Japan’s Himawari-8 and the US GOES-17. Fascinating to see the different perspectives.” Originally tweeted by Simon Proud (@simon_sat) on January 15, 2022.
JM

