
International Geospatial Briefing June 27th: 1. Deepest Point of Antarctica’s Southern Ocean Mapped; 2. Digital Twin of Denmark’s Transmission Network; 3. Map Compares the World’s Mountains and Rivers; 4. How Geospatial can be Applied to Climate Challenges; 5. When Digital Tools Fail to Document; 6. Shifting from Response to Recovery
1. Deepest Point of Antarctica’s Southern Ocean Mapped
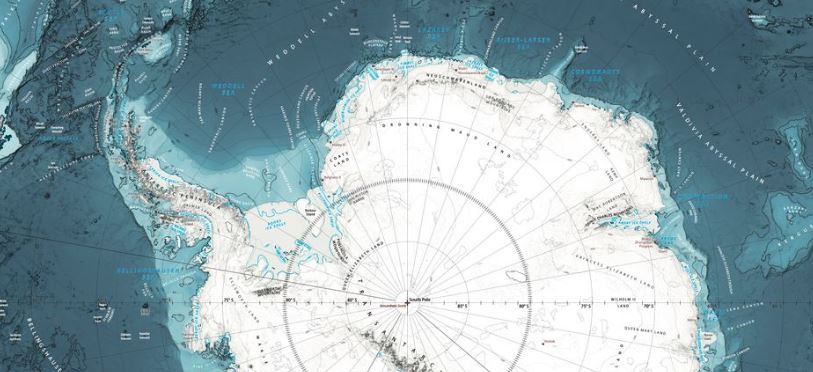
The deepest point of the Southern Ocean surrounding Antarctica – a 7,432-meter (24,383-foot) deep trench called the Factorian Deep – has been closely detailed in a new project to map this vast sea floor. The results are the most extensive map of this corner of the world yet, covering a total area of 48 million kilometers squared (18.5 million miles squared), an area roughly five times the size of Canada. A high-resolution map of the Southern Ocean can be downloaded free from the project’s website: www.ibcso.org.
Satellite data of the Southern Ocean has been around for a while, but this imagery lacks some of the finer details picked up by ship-based methods of mapping the seafloor. This research has helped discover an abundance of unique biodiversity and can provide invaluable insights into our planet’s geological history and its climate. Read more here.

International Bathymetric Chart of the Southern Ocean (IBCSO)
2. Fugro to Develop Digital Twin of Denmark’s Transmission Network
Denmark’s Energinet has awarded Fugro a 5-year framework agreement to capture aerial Lidar and imagery data of the 3,000-line-km electricity transmission network. The acquired geospatial data will be processed through Fugro’s Roames technology to develop a 3D digital twin of the network to report on critical clearances.
Fugro’s Roames technology is designed specifically for power utilities, combining innovative 3D mapping techniques with advanced machine learning and cloud computing to create a digital twin and detailed analytics for remote asset inspection, identification, and condition assessment. This includes sag and swing of electrical conductors, vegetation analytics, individual tree crown detection, fall-in, and critical tree risk identification. The overall objective is to reduce risks across the transmission network and support the maintenance of Denmark’s infrastructure. Read more here.
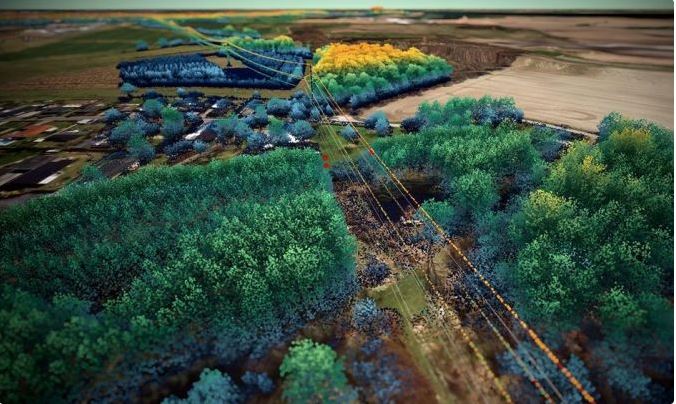
Fugro Roames will be used to create a 3D virtual network model of Denmark’s power distribution network.
3. Iconic Infographic Map Compares the World’s Mountains and Rivers
Iconic and beautiful historic maps from around the world are now widely accessible, giving viewers a rich tapestry of artistic expressions through cartography. Visual Capitalist now hosts a variety of these images and can be viewed here.
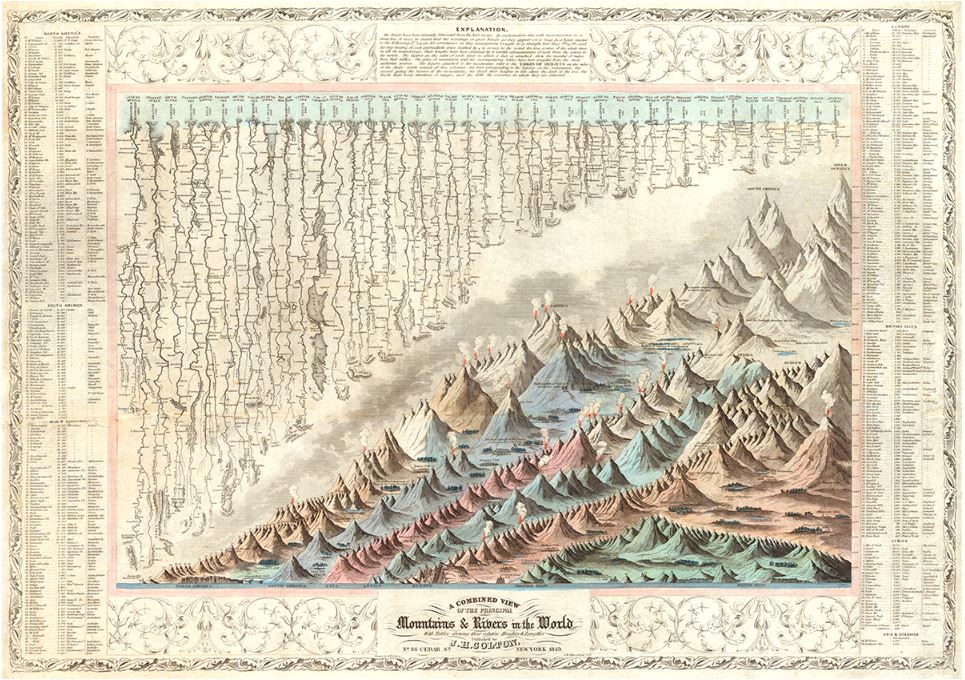
This is believed to be the first edition of the iconic mountains and rivers infographic map.
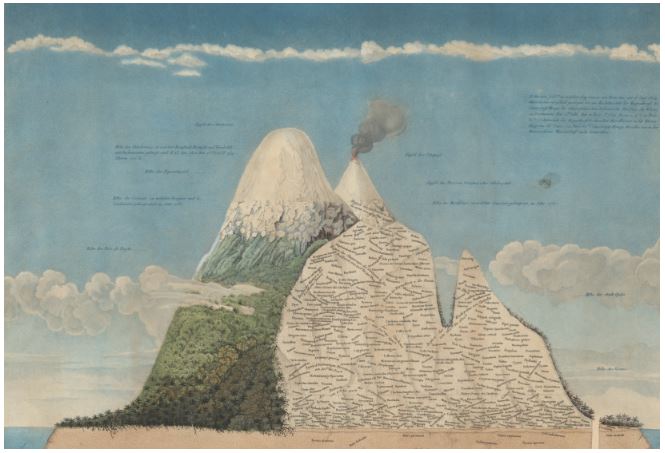
This was produced by Alexander von Humboldt in 1805., and shows geographical features in a way that was extremely novel at the time.
These maps express the style and detail of the periods they were drafted. The article features works from cartographers such as William and Danial Lizars, Alexander von Humboldt, and J.H. Colton.
4. New Guide Demonstrating how Geospatial can be Applied to Climate Challenges
Following the recent Cambridge Conference, where geospatial leaders from across the globe explored the key role geospatial data can play in the climate challenge, OS and the global community have published a report called the ‘How’ Guide – Applying Geospatial Information to Climate Challenges. The Guide pinpoints four practical steps the global geospatial community must take to influence governments and decision-makers to help the planet mitigate climate damage and achieve adoption goals.
The group recognizes that members from each country must take ownership of their own challenges and provide active direction for private organizations and their respective governments while continuing to work together to propose solutions and inspire others to apply geospatial capabilities in direct response to climate challenges. Read more here.
5. Invisible Landscapes: When Digital Tools Fail to Document
As a component of Google Maps, Google Street View naturally replicates how Google Maps works – where the driver is commercial profitability drawn out from advertising revenue. This revenue allows Google Maps to be free, but the flip side of that is that in effect it achieves a near monopoly, where not all cities are seen as equally worthy of documentation.
Despite its availability across 83 countries, Google Street View remains hugely limited across the global south. Many places have little to no coverage. In Africa, only 13 countries have been mapped, while almost all of Central America has yet to be mapped. Much of Asia and the Middle East are similarly unavailable. It’s a reflection on how digital technologies that can help us make sense of the built environment, can end up reiterating the unequal systems of power the world runs on.
In 2018, Zimbabwe’s capital city of Harare was unavailable on Google Street View. A Zimbabwean Silicon Valley Product Manager – Tawanda Kanhema – decided to change that, volunteering to carry Google Street View’s recording gear to map Harare, and what would later become 2,000 miles of his home country. Read more here.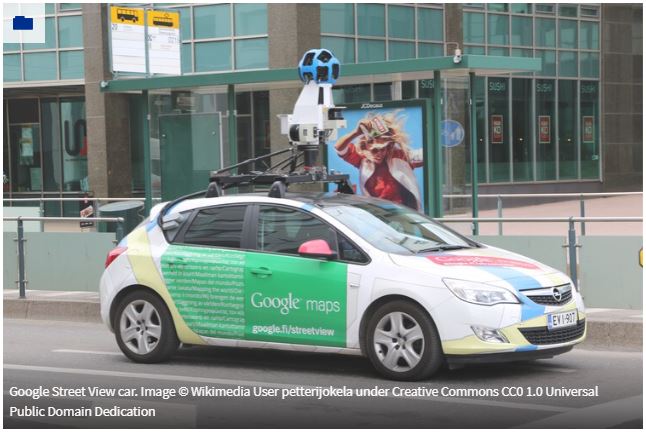
6. Shifting from Response to Recovery
Local governments nationwide have experienced a surge in natural disasters, resulting in billions being spent on the resources required to repair their communities. According to Climate.gov, the total cost of U.S. billion-dollar disasters over the last 5 years (2017-2021) is $742.1 billion (a 5-year annual cost average of $148.4 billion). Government leaders are the main defense system against catastrophes. This responsibility not only involves prepping communities for potential disasters but also responding to and managing recovery from events in a timely manner.
While speed is of utmost importance in recovery, caution cannot be overlooked. This is where aerial imagery can provide a safety measure by giving local government leaders access to truth-on-the-ground without having to risk the potential dangers of being physically present in a catastrophic scene. Geospatial technologies are key to relaying efforts undertaken by local leaders, restoring areas impacted by natural disasters, and capturing accurate assessments of an event’s impact. Read more here.


