International Geospatial Briefing Oct 25th: 1. Interactive map of hidden archaeological landscapes. 2. GIS helps asylum seekers 3. Extent of California oil spill. 4. Mapping Bogota’s neighbourhoods 5. Map Tools international travel requirements 6. New York new subway map 7. GeoSLAM maps underground refugee shelter from Spanish Civil War
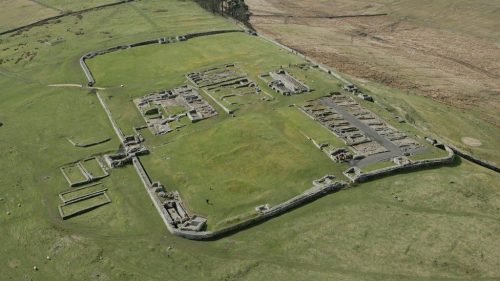
This Interactive Map Lets Users Explore England’s Hidden Archaeological Landscape
Attention all history enthusiasts, Historic England has created a new interactive map that allows users to take a “virtual flight” over England to explore the country’s many hidden archaeological landscapes. Researchers created this map by using 3D laser scans and about 30 years worth of more than half a million aerial images. The interactive map shows historic sites dating back 6,000 years and includes structures from the Cold War as well as the First and Second World Wars. Each historic monument has a unique monument number that takes you to the Heritage Gateway webpage where you can go to learn more about that monument and visit the historic environment records.

Articles can be viewed here and here.
Texas State graduate students aid Afghanistan refugees
GIS graduate students at Texas State University are teaming up with non-profits and national agencies to help families seeking asylum evacuate Afghanistan. The graduate students are using satellite cartography and communication to create a path for refugees to safely exit the country. This project, named Digital Dunkirk, began back in August when the CEO of an artificial intelligence and data science company reached out the geography department at Texas State to see if anyone with GIS experience could help. The networking hardware company Cisco also played a role in this project by developing a large database of people inside Afghanistan who needed help. Additionally, many other agencies and individuals came together to use their expertise to help create the best path to safety for those families in need.
Article can be viewed here.
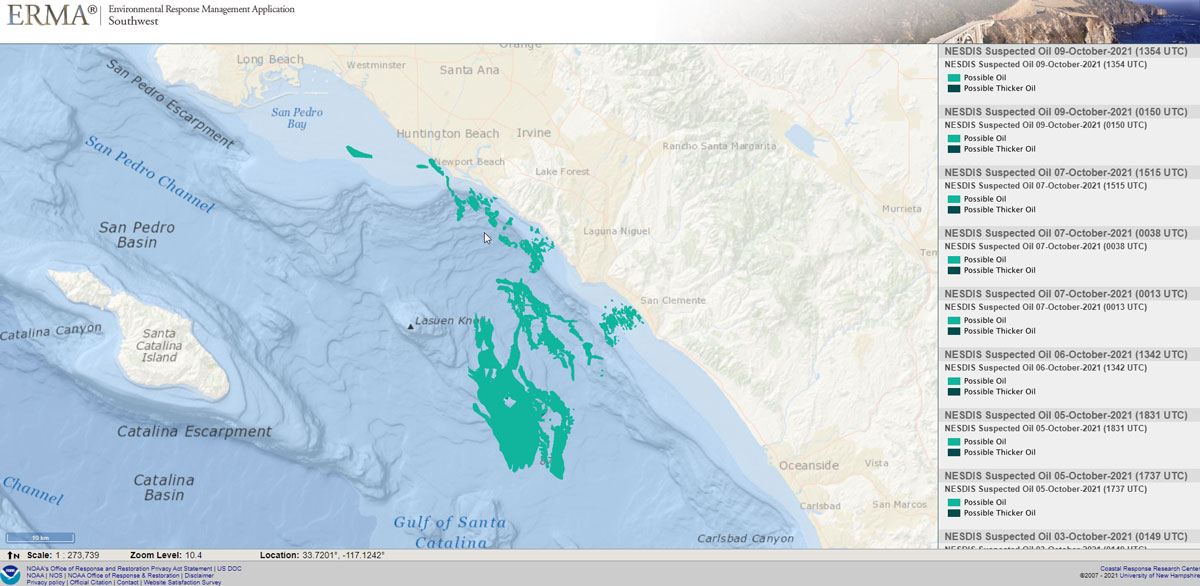
Interactive map of Orange County oil spill
The National Oceanic and Atmospheric Administration (NOAA) in the United States, through their Environmental Response Management Application, has created an interactive map that shows the extent of the recent oil spill off Orange County in California. The United States Coast Guard estimates that a spill of around 588 barrels occurred, which would equal 24,700 gallons (112, 288 liters) of oil. The map uses satellites, such as, Capella, Radarsat2, Sentinel, Aster and Iceye to detect the regions of a possible oil spill.
Article can be viewed here.
Mobile and Aerial Mapping to Protect Bogotá Residents
The city of Bogotá in Colombia is using artificial intelligence to work on improving neighbourhoods that may be extremely vulnerable to disasters, such as earthquakes. To do this, they are combining aerial photographs taken by UAVs with street level photographs taken with a vehicle-mounted Trimble MX7. Through the collection of this data and by using machine learning algorithms, they can then identify structures and urban spaces that need upgrading. By using this technology, certain areas that may have been invisible to decision makers in the past will now be in the spotlight and hopefully receive the upgrades needed to reduce the vulnerability for future disaster events.

Article can be viewed here.
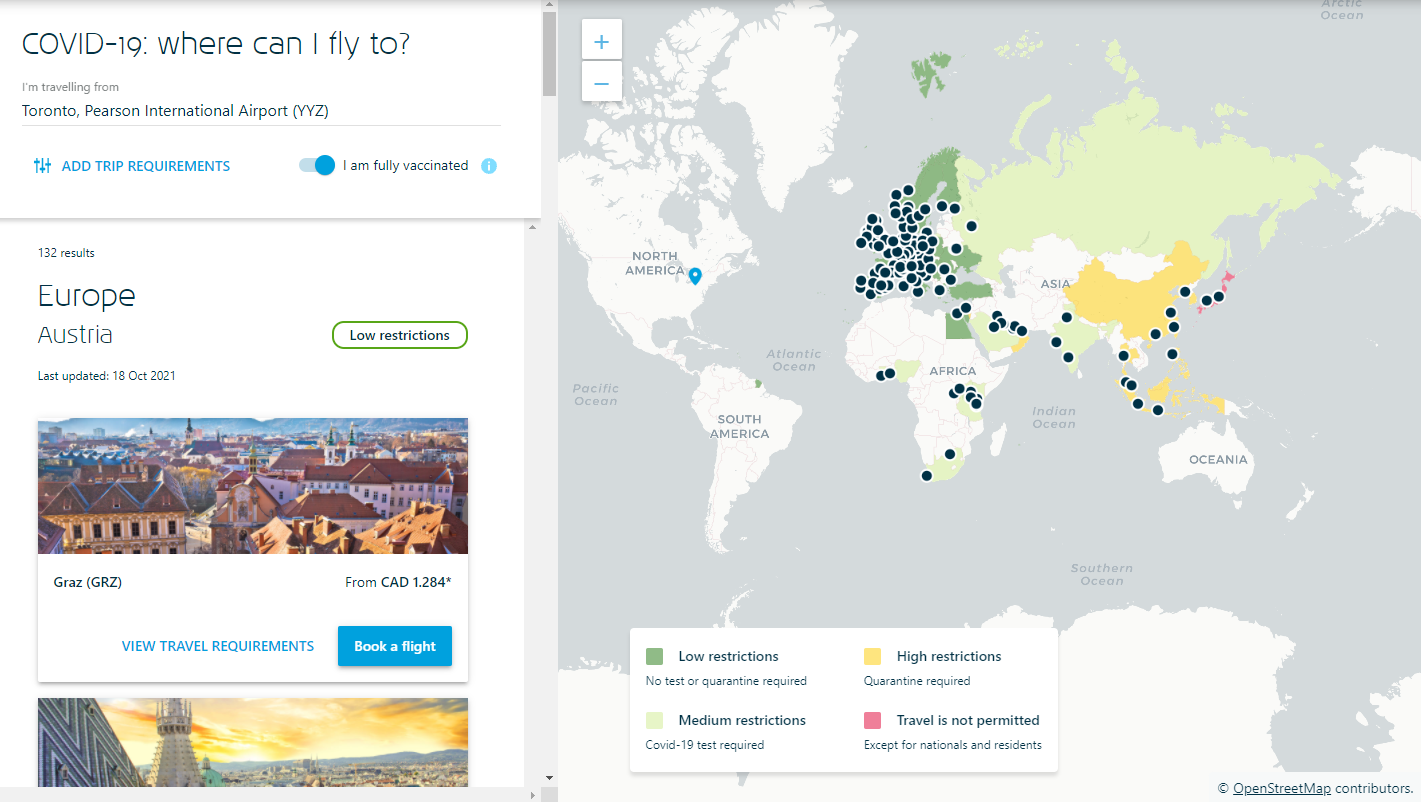
KLM’s new interactive map highlights country-to-country travel requirements
The Dutch airline KLM has created a new tool for international travel. This interactive map gives you up to date information and shows you all entry requirements for the countries you can fly to with KLM airlines from whatever start city you choose. When clicking on the several travel destinations a box will appear that displays the cost of the flight. It will also show if the area you have selected to travel to has low-high restrictions or if travel is not permitted from the start city you have chosen.
Article can be viewed here.
MTA Tests New Subway Map That Evokes Jettisoned 1972 Version
The New York subway map is getting a not so new look. After 40 years of the same map New York’s Metropolitan Transportation Authority is testing a new subway map that resembles the same one that was used in the 1970s. This upgraded map is distorted to allow for better representation of the subway system and to better show the interaction between the system’s tracks. This map is currently being tested and if well received by those who use the subway, the Metropolitan Transportation Authority hopes to make the shift from the map they are currently using to this updated version of the map that looks a lot like the one they used in the 1970s.

Article can be viewed here.
Spanish History Uncovered by GeoSLAM
The 3D Geospatial Technology Solutions company, GeoSLAM, is showing their ‘walk and scan’ method of collecting data by creating a digital replica of an infamous refugee shelter used in Spain during the Civil War. Refugees used these shelters to protect themselves from air strikes during the county’s Civil War in the 1930s. GeoSLAM was able to replicate this 145-meter tunnel by using the ZEB Horizon scanner that can collect 300,000 points per second, is able to acquire data from 100m away and has up to 6mm of accuracy. This impressive project was also completed in one scan and although it was done above ground, it was still able to capture an incredible amount of detail.
Article can be viewed here.