Mapping air pollution: a momentary shift due to COVID-19
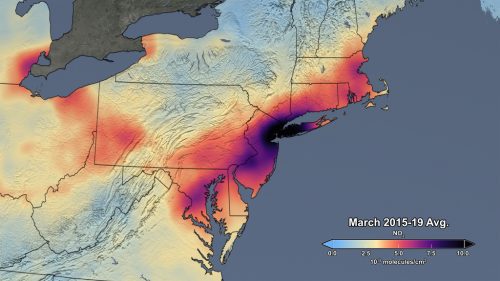
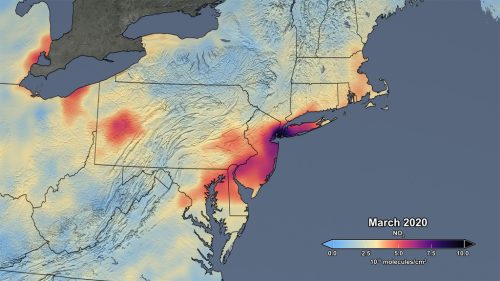
COVID-19 and the resulting economic shutdowns and physical distancing measures have presented us with a peek at what it takes to reduce air pollution and better the world’s air quality. Recent satellite data mapping has shown drastic reductions in nitrogen dioxide (NO2) across the world since lockdowns have been implemented. NO2 is used as a measure for air quality overall since it tends to disperse faster than other greenhouse gases, making it the preferred metric of change in a short timeframe. Here in Canada, scientists from Environment and Climate Change Canada have noticed NO2 rates falling more than 30 percent in cities like Toronto and Montreal. While these reductions are temporary, as we will all likely go back to our old norm when permitted, this is a glimpse into how our daily behavior affects emissions and what the results could be when we band together to make change.
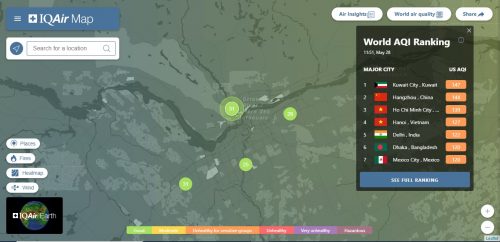
Though much of the studies and research have been presented to us through the media, we too can look at the maps and see for ourselves how city air pollution varies globally. Using IQAir’s interactive mapping tool, anyone can view real-time air quality and pollution data anywhere in the world. Collaborating with the United Nation Environmental Program, IQAir is the largest air quality data platform. The interactive map is created from data collected by governments, private organizations, community groups and citizens around the world using IQAir’s monitoring technology. Measurements of PM2.5 (a fine particulate matter) received from on-the-ground monitoring stations, as well as from IQAir’s privately owned sensors. PM2.5 is a component of outdoor air pollution and exposure to it is very dangerous to human health. The mapping tool displays the concentration of PM2.5 (a fine particulate matter) as visual representation of air quality.
For most of us, this is the first pandemic we’ve experienced and one of the lessons we’re learning is how our behavior quickly impacts our environment. While the latest reports on better air quality is said to be temporary, we will hopefully learn from this accidental experiment and make lasting changes globally. At least for now — as of May 28th— in Ottawa, we’re doing pretty good.
Sources:
https://www.cbc.ca/news/politics/covid-air-pollution-cut-1.5579452
https://www.iqair.com/ca/air-quality-map
https://www.nasa.gov/feature/goddard/2020/drop-in-air-pollution-over-northeast