
Sparkgeo uses geospatial technology to analyze water hazards caused by BC wildfires
Western Canadian wildfire season is quickly approaching.
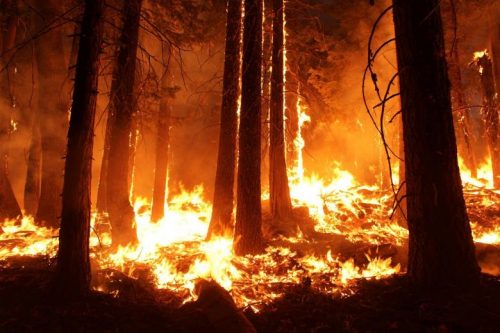
The increase in wildfire season length, wildfire frequency, and burned area makes it dangerous and difficult to live in and around these regions. Wildfire smoke can drastically reduce air quality locally and even thousands of kilometres away. The direct threat from wildfires to people, property, and ecosystems can have deadly and lasting effects.
We may see global wildfires increase more than 50 percent by the turn of the century. To mitigate our exposure, we must understand how they impact and interact with ongoing natural events and hazards.
Burn scars, flash flooding, landslides and water quality
At Sparkgeo, we’ve been looking at landscape changes caused by wildfires, specifically burn scars. Recently burned landscapes lack the forest floor debris and undergrowth vegetation required to slow the erosion effects of water in mountainous terrain. And water is the most significant erosive force on land.
High temperatures during wildfires make the soils water repellant and can act similar to charcoal. These cumulative effects reduce the amount of water absorbed into the land, enabling more overland flow, leading to flash flooding and less stable slopes.
This also heightens the likelihood of debris flows and landslides – further amplifying any high water events that may already be taking place. As more water moves faster through the land, it moves more sediment into waterways reducing water quality in nearby reservoirs.
The chain of events that happen post-fire can have real consequences to people, infrastructure, and property downstream and downslope. Looking at these events at the watershed level can help us quantify and evaluate the severity of the hazard and the impact on the larger basin and events downstream.

Local analysis of British Columbia watersheds
Like in other parts of the world, British Columbia (BC) has seen an upswing in wildfires over the last few decades, along with an increase in precipitation. This is important as runoff can increase as much as thirty percent in the first year after a forest fire, bringing more water into BC rivers. Scientists also discovered that the larger the burned area within the watershed, the greater the increase in streamflow.
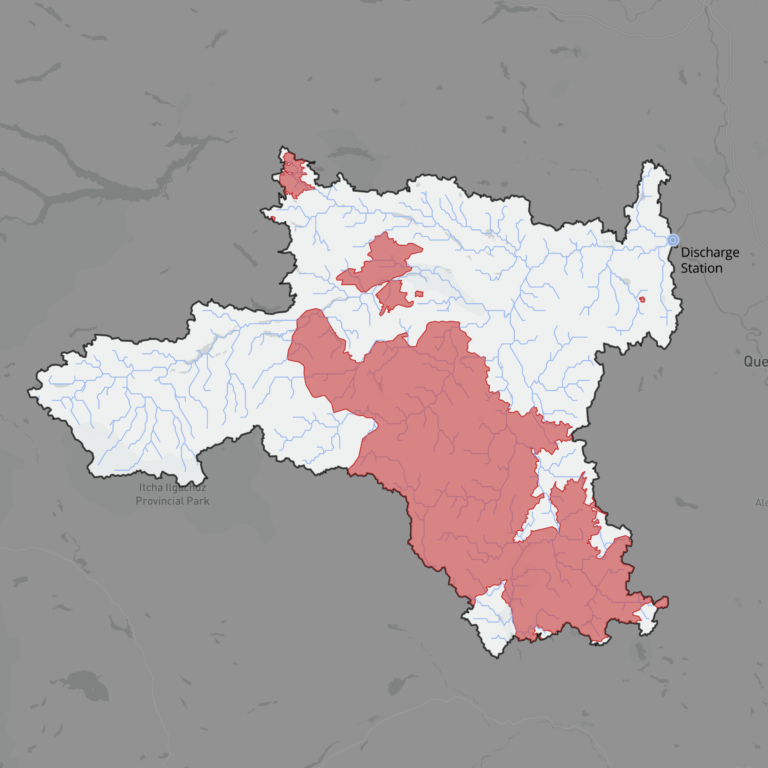
We wanted to see whether we could observe this change in post-fire river flow in BC watersheds. We looked at the Dean River watershed located in the Central Coast region of British Columbia. The 2018 Dean River fire burned an area that covered 43 percent of the watershed. The precipitation after the fire in the fall remained similar to previous years, however, the total flow had increased significantly.


A similar pattern is observed in the West Road River watershed, east of the Dean River watershed, where a fire in 2017 burned 35 percent of the watershed area. Even though total fall precipitation didn’t increase from previous years the total fall discharge increased in the following years.
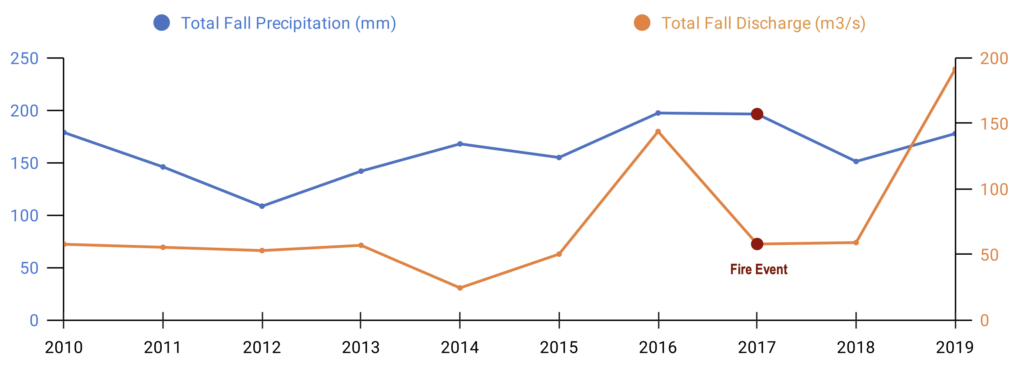
These are just a few examples that demonstrate that this chain of events is already happening in BC watersheds. We need to broaden our understanding of these hazards and their interactions with other hazards and the landscape.
Adaptation and geospatial technology
We also need to become more adaptable to these types of events and anticipate the adverse effects of climate change so that we can take appropriate actions to prevent or minimize the damage they cause. This way, we can decrease our exposure and in turn, become less vulnerable when these natural hazards occur.
In previous blog posts, we described the broader implications and why organizations need to monitor ESG criteria. Organizations understand what hazards exist and where. However, the cumulative effects of climate change are increasing exposure faster than expected.
By studying the existing tools and approaches to understanding natural events, organizational adaptation to climate change becomes more flexible. And risk becomes easier to manage.
Regardless of how we adapt, we must adapt.
Visit our website for more information coming soon on this project.
Contact us to learn more about our ongoing geospatial work in climate change adaptation.