

The Ottawa Tree Canopy Cover Mapping Project
The City of Ottawa Official Plan set a target of 30% tree canopy cover for the entire city. To the author’s knowledge there is no information on the amount of tree canopy for the entire city of Ottawa. A CITYgreen study report published in 2008 indicated that the urban area has a tree cover of 27%. However, a staff report on a two-year review of the of the Urban Tree Conservation By Law states that the tree canopy cover for the urban area is 17%. Clearly, there is no definite information on tree canopy cover for the urban area and for the city as whole.
Recognizing that baseline information on tree canopy cover is not available the Ottawa Forests and Greenspace Advisory Committee (http://www.ottawaforests.ca/) initiated a project that would try to provide that information. The project takes advantage of free and open source GIS software (FOSS GIS) and the concept of Public Participatory GIS (PPGIS) to extract the data/information. The project is called The Ottawa Tree Canopy Cover Mapping Project and uses volunteers to employ the dot grid mapping technique.
Dot grid mapping is a technique for measuring tree canopy cover that involves overlaying points on a set of imagery and then classifying the points based on a specific classification scheme. The points can be distributed in a random fashion or as a regular grid of a specific distance (e.g., 100-m distance between each point). This method is easy to do and relatively cheap to implement. The most costly material is the source of imagery. This cost can be eliminated by using Google Earth imagery. However, using this imagery source can limit flexibility since there is no control over the dates when the set of imagery is taken. Furthermore, the ability to do temporal analysis is severely limited since it is most likely impossible to get multi-date imagery over the same area. One source of imagery can be the municipalities where the tree canopy cover project is undertaken. Some municipalities regularly collect imagery over their area and may allow public access to the imagery. This is most likely possible in municipalities that have embraced the concept of Open Data since they tend to provide the imagery data for anybody to use.
Although relatively easy to do there is still a need for some technical knowledge when employing the dot grid mapping technique. A GIS technical person is needed to prepare and process the vector and raster data. Data need to be loaded on to the software taking into consideration such GIS concepts as projection, scale, data layer creation, data manipulation, file management, etc.
Software used in the Ottawa Tree Canopy Cover Mapping Project is called Quantum GIS (QGIS). The software was used because it is able to load all the GIS data and contains features that allow for the analysis of the data. It has functionality to create the grid points that are overlain on the imagery and that will be classified. Since QGIS is free and open source there are no license restrictions in the use of the software. In contrast to commercial software it is possible to distribute the software to any user without incurring any costs. This is very important especially for this project because its success heavily relies on volunteers to do the point classification. Having to pay for software licenses for the use for each of the volunteers would have been prohibitively costly.
GIS data used in the project included airphoto imagery provided by the City of Ottawa (taken in 2005 and 2011 with pixel resolution degraded to 40cm). The availability of airphoto imagery taken at two different years will allow for the ability to do temporal analysis and determine any changes in tree canopy cover between the two dates. Ancillary GIS data included roads, water polygons, and city boundary all of which are available through the City of Ottawa Open Data Portal. Boundary data for Ottawa neighbourhoods was available from the Ottawa Neighbourhood Study. These ancillary data were used to provide location context to volunteers and to allow them to recognize areas they are responsible for.
Geographic boundary data for the Ottawa urban area is not available in the Open Data Portal. However, a map of the urban boundary is available as a pdf document. To create a vector layer dataset of the urban boundary the pdf document was converted to TIFF format. The resulting TIFF file was then loaded into QGIS and geo-referenced by collecting ground control points (GCPs) based on the road data. Once geo-referenced the TIFF document was then used as a backdrop for creating the urban boundary polygon. This was done using the digitizing tools within QGIS.
The project used a regular grid of points 100 metres apart. The grid was created within QGIS and used the urban boundary vector data layer as the Area of Interest (AOI). This resulted in the creation of 59,956 points. To reduce the number of points that have to be classified the water polygon layer and the Greenbelt polygon layer (the Ottawa Neighbourhood data included the Greenbelt as one of the neighbourhoods) were used to select the points that were located on water and the Greenbelt. The selected points were then eliminated from the project. This process resulted in reducing the number of points to 37,278. Since there were two sets of airphoto imagery (2005 and 2011) the number of points that need to be classified doubled to 74,556 points.
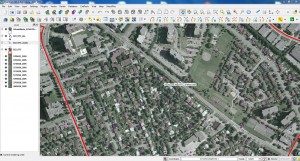
Figure 1. Regular grid of points set 100-m apart overlain over City of Ottawa airphotos.
Airphotos courtesy of the City of Ottawa.
A preliminary study indicated that ~200 points can be classified per hour; with 74,556 points it will take about 372 hours to classify all the points! With this in mind, it was decided to just focus first on the 2011 airphoto imagery and provide a complete report on it. If the project is successful at this point then it should entice additional volunteers to participate in the classification of points for the 2005 airphoto imagery. To keep each volunteer’s commitment to the project manageable the AOI was broken down to chunks of areas containing an average of 1200 point resulting in 30 separate areas. The areas were distributed to volunteers either through DVDs or through ftp download.
Although the project is primarily concerned with determining tree canopy cover it was decided that this should also be taken as an opportunity to get other land cover information. Therefore, a five-category classification scheme was adopted. The categories were: trees, other vegetation, impervious surfaces, bare soil, and water. The idea is to cycle through the points individually and then determine what category it falls on based on the airphoto imagery.
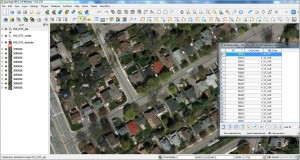
Figure 2. Volunteers go through each point and classified into 1 of 5 categories
(1=Tree, 2=Other Vegetation, 3=Impervous Surface, 4=Bare Soil, 5=Water). Airphotos courtesy of the City of Ottawa.
OFGAC scheduled a training workshop for April 27, 2012 and put out a call out for potential volunteers. The training workshop was designed to introduce the project, outline the methodology, and to provide examples of the five different categories. About 30 people attended the training workshop and 20 people volunteered to participate in the project.
To date (August 2012), 95% of all points for the 2011 airphoto imagery have been classified. The next step is to conduct a Quality Checks (QC) on the collected data in order to provide an assessment of the accuracy of the point classification. The plan is to finish a full analysis and report by the end of September 2012 and to present the results to Ottawa staff and Ottawa council. Classification of the 2005 airphoto imagery has also started with 13 volunteers signed up.
For more information about the project please go to the OFGAC website (project specific site http://tinyurl.com/ottawatreecanopy) or contact Regie Alam, Project Lead (see author information).


Hi Regie,
I would like to complete a similar project, how did you determine the number of sample points? This seems to be a common method, however, there is little information on sample size!
Hello Sarah,
The number of sample points in this project was determined by an estimate of how many people we can potentially attract to help out. We did a pilot project and determined how many points a person can do in an hour. Then we tried to estimate how many hours each person will be willing to volunteer. Based on these factors and the size of our study area we justified that a 50m distance between points was appropriate. However, I did add in a set of random points at the end to complement the regularly spaced grid.
Here is a link (http://www.isa-arbor.com/education/resources/educ_TreeOrdinanceGuidelines.pdf) if you want a more formal determination of the sample size.
Hi Reggie,
I’m familiar with the ISA guide, however, my stats are a tad rusty! Any calculation examples would be much appreciated 🙂
What is the spacing on your grid? I have seen a presentation where a 45.72m spacing was applied to communities of differing sizes(15.16-31sqmi).