
Your International Geospatial Briefing for September 14th: Where the GISP’s are; China’s new Earth Observation Sattelite; COVID-19 push to aerial surveying; Interdisciplinary data-driven approach; Interactive historic map that shows your hometown’s location 750 million years ago
A Look at where the GISPs are
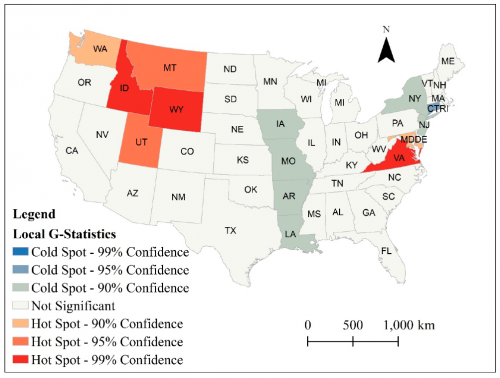
Dr Dapeng Li, an assistant professor at South Dakota State University, and a couple of researchers examined the characteristics and spatial patterns of the Geographic Information Systems Professional (GISP) in the United States. The results show that the majority of GISPs (97.3%) are in urban areas, 75% are male, 43.3% play a managerial role and 54.5% assume non-administrative roles. Additionally, spatial patterns were observed in the possession of GISP across the United States. Two hotspots and two cold spots were seen. The first hotspot is centered around Idaho and Wyoming, while the second hotspot includes Virginia, Washington DC, and Maryland. One cold spot was found in Iowa, Missouri, Arkansas, and Louisiana in the central U.S., while the other coldspot includes states such as Connecticut, New Jersey, and New York on the East Coast. Link to the article here:
China launches another Gaofen Earth Observation Satellite
China recently launched another earth observation satellite which was equipped with a pair of experimental rideshare payloads for the Chinese military. This is the fifth in a series of Goafen 9 Earth observation satellites, with the previous satellites launched in 2015 and on May 31, June 17, and August 6 of this year. The two-stage Long March 2D rocket deployed the Gaofen 9-05 satellite and two secondary payloads into a polar orbit roughly 300 miles (nearly 500 kilometers) above Earth, with an inclination of 97.5 degrees to the equator. China’s state-run Xinhua news agency says the new satellite “will be mainly used for land surveys, city planning, land right confirmation, road network design, crop yield estimation, and disaster prevention and mitigation,”.
Source: https://spaceflightnow.com/2020/08/24/china-launches-another-gaofen-earth-observation-satellite/

COVID-19 push to aerial surveying and mapping
COVID-19 pandemic has caused a diversion from our ideal ways of life, leaving organizations with no other option than to adopt solutions which will accommodate the ‘new normal’. However, the situation seems to be different for drone technology as there seem to be increased interests for its usage in accomplishing aerial surveying and mapping. The pandemic surge in Argentina led to the sudden demand of approximately 1200 hospital beds, hence, the authorities adopted drones to quickly survey sites to build modular hospitals across the country. The quick data collection made the project faster than what could have be achieved using traditional surveying methods. Besides the faster rates of results turnover, a greater benefit of using drones is getting accurate data with lesser people on the ground. While this presents an advantage for the drone and UAV manufacturers, it also poses a challenge to professionals accustomed to traditional survey methods.
Source: https://www.geospatialworld.net/blogs/covid-19-push-to-aerial-surveying-and-mapping/

Sarah Williams: Applying a data-driven approach to help cities function
The future of big data is exciting, although Sarah Williams believes that “big data won’t change the world until we synthesize it into tools with public benefits”. Sarah Williams, an associate professor of Urban Research at MIT is also a geographer, an architect, an urban planner, and a data scientist. She has done a good job of combining these fields to create data-driven insights and striking visualizations that have generated public interest.
Source: https://news.mit.edu/2020/sarah-williams-data-cities-0908
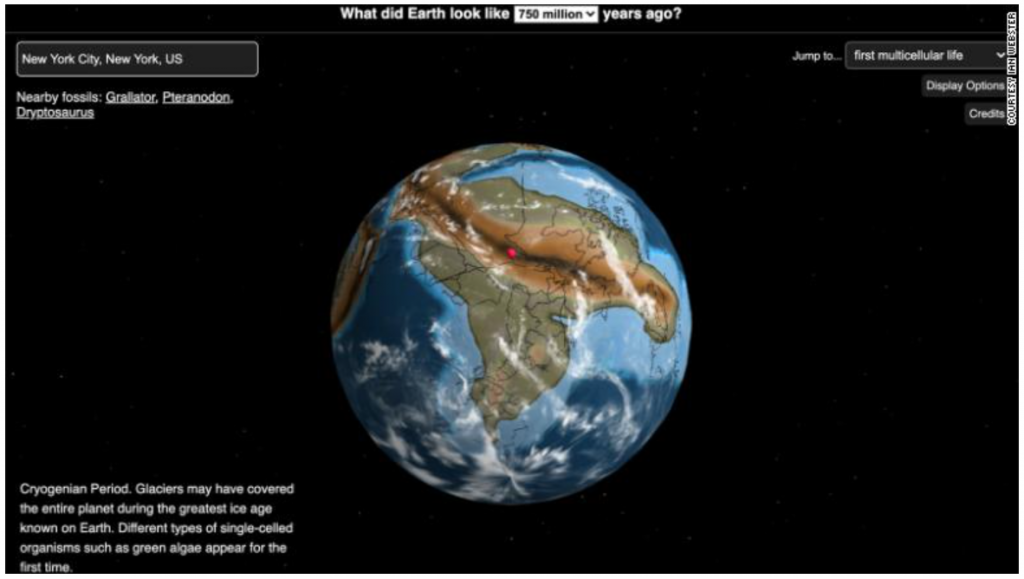
This map lets you see where your hometown was on the Earth millions of years ago
A California paleontologist has created an interactive map that allows people to see how far their hometowns have moved over the 750 million years of continental drift. The online map, designed by Ian Webster, features a range of tools that also make it easy to discover more about the Earth, such as where the first reptiles lived or when the first flower bloomed. Webster’s map visualization allows users to enter their location and then plugs that location into plate tectonic models. The result is that users can see where towns and cities were located hundreds of millions of years ago.
Interactive Map showing places millions of years ago


