
Traffic accidents are one of the significant concerns of public institutions and organizations that risk human life after major diseases. Analyzing historical events and taking proper actions could prevent massive numbers of severe injuries and deaths. Understanding historical records could represent the areas of concern and their characteristics and allows more safety evaluation and remedies. However, crash and accident data could be very challenging and complex to analyze. Here is where GIS technology can help explore both spatial and temporal aspects of traffic accidents. It supports operational needs to improve safety and proper allocation of resources to improve transportation safety.
How can GIS reduces accidents ?
Spatial and temporal analysis would be the first two foundations in GIS analysis of crashes. Most traffic accident studies would start by locating the accident. Spatial aspects comprise of road type (road curves, ramps, and bridges), population density in the area, weather, culture, distribution of facilities, etc. Hotspot analysis (hotspots and cold spots), number of accidents occurrence, distribution of accidents during different periods of time, and date of the accident could be used to identify temporal patterns. When black spots are specified, then the causes of the events will be figured out by spatial relationship analysis between accidents and road network elements. Also, driving factors of traffic accidents should be examined from a perspective of planning, design, and road structure for a better conception of accident patterns, road safety, and decision making. These analyses are progressed easily with the help of the Geographic Information system (GIS).
Spatial analysis
Using spatial data, GIS can provide spatial integration, spatial analysis, spatial visualization, and many other spatial functions (Liu & Zhu, 2004) through latitude and longitude coordinates of the accident occurrence, geocoding the addresses that were collected from the accident reports on a reference layer, analyzing characteristics of a specific location on the transportation network over time. Also, Macroscopic parameters in traffic accident analysis such as traffic speed, traffic volume, density, spot speed, and space mean speed can be linked with each other, environmental data, and socio-economic elements through GIS to illustrate the relationship of traffic accidents and mentioned features (Ng et al., 2002). As a result, a particular type of traffic cluster can be shown on a map, or queries can select a traffic accident with common features. These capabilities made GIS the most practical tool in traffic accident analysis.
Temporal Analysis
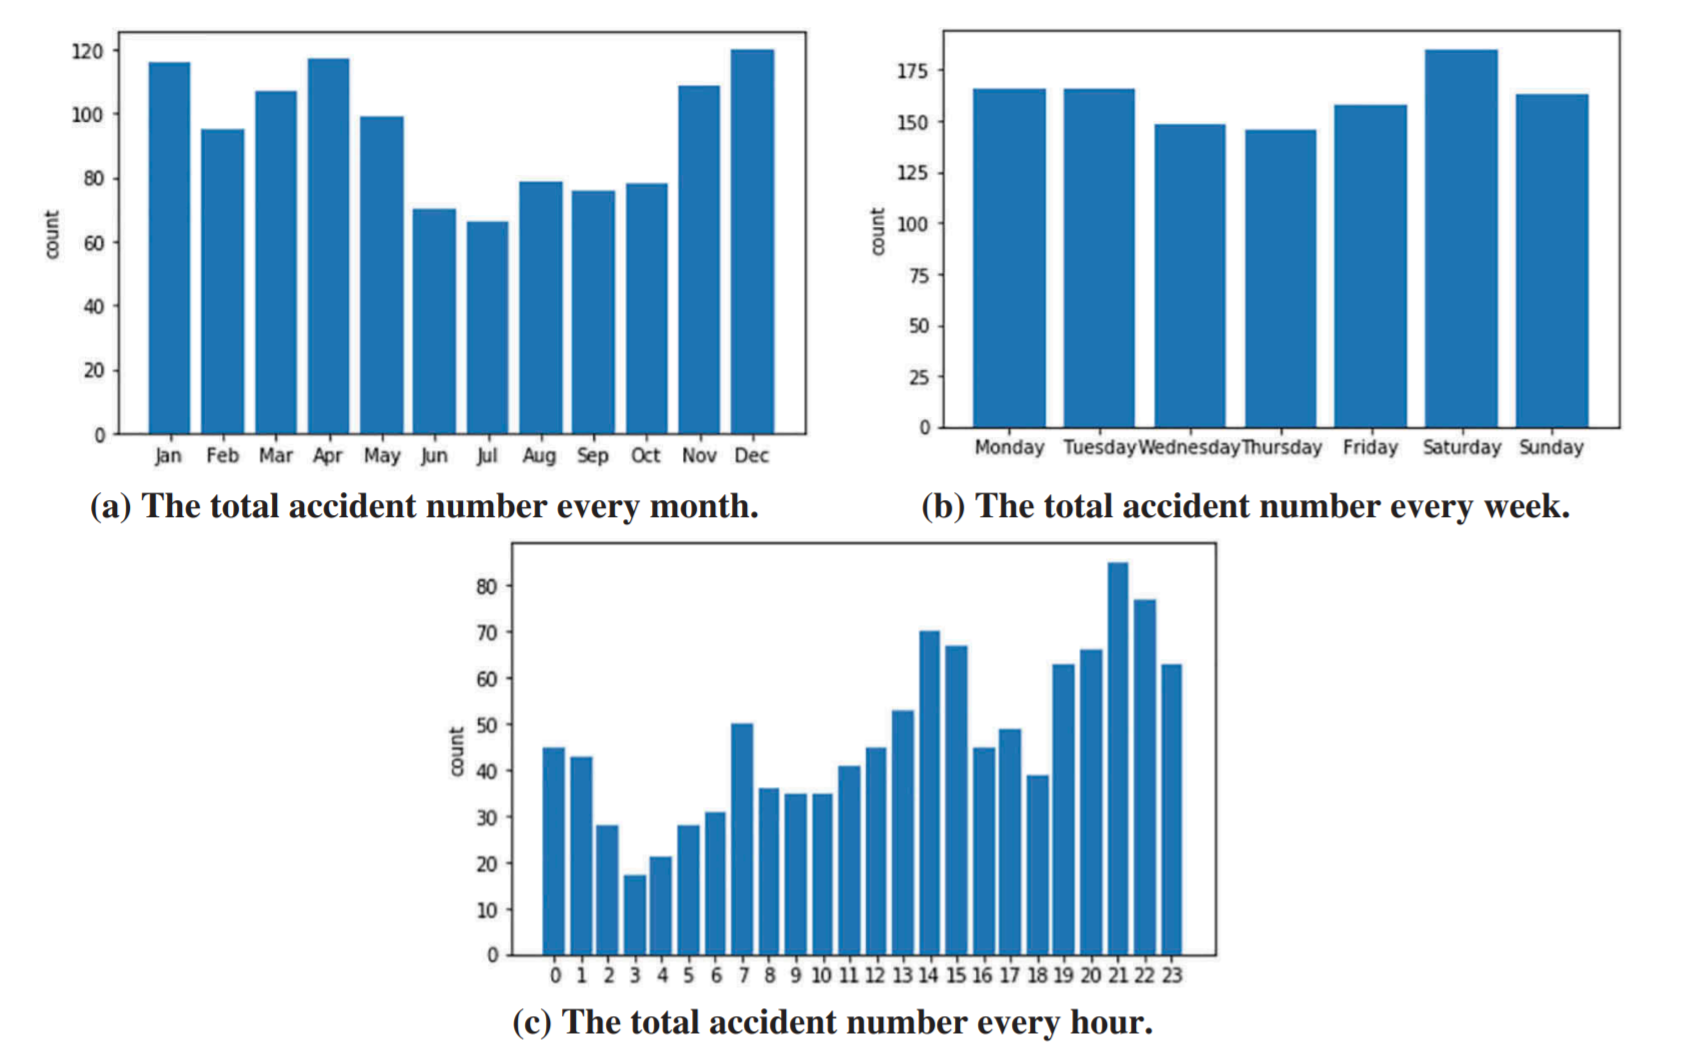
In order to have a long-term evaluation of total accident trends in a region, a temporal analysis would be required (Bíl et al., 2019). It is crucial to figure out precise accident patterns. The frequency distribution of the accidents would link the time of the accident and other effecting factors such as the traffic flow, weather conditions, etc. Accident time series, graphs, and spider plots are some of the visualization approaches of temporal analysis, including year, month, date, and hours of accidents. Temporal analysis can be done based on various scales, such as daily, weekly, monthly, or even seasonal, based on the purpose of the investigation.
How can GIS integrates analysis?
Geographic Information System (GIS) has made detecting traffic accident hotspots in transportation networks easier. GIS is an intelligent analysis tool that is usually applied to deal with multicriteria issues and combine multiple maps and layers to create an integrated output. Using GIS which has always been an integrated tool that could analyze accessibility plans, has enabled researchers to take advantage of analyzing collected data concerning their importance. It also allows analysts to conduct complex assessment of the situation and provide network analysis and hotspots.
Improving Road Safety
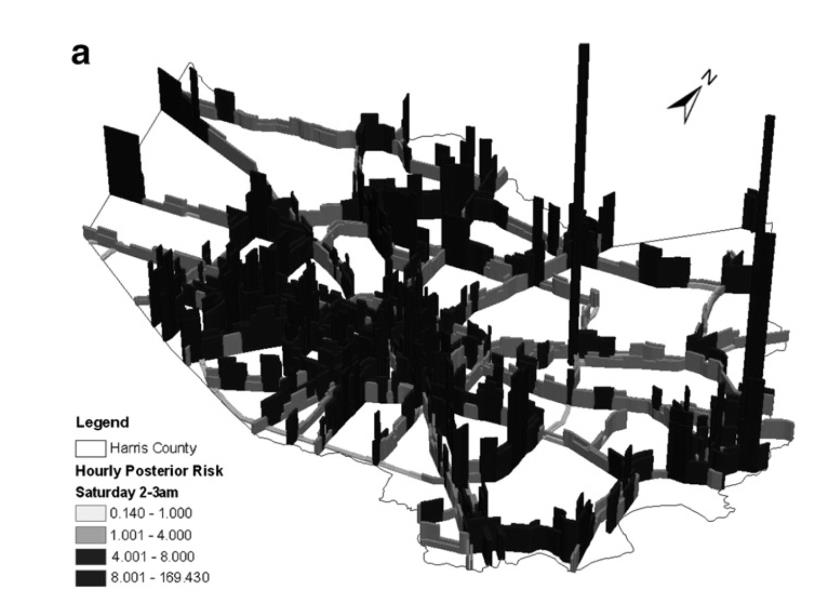
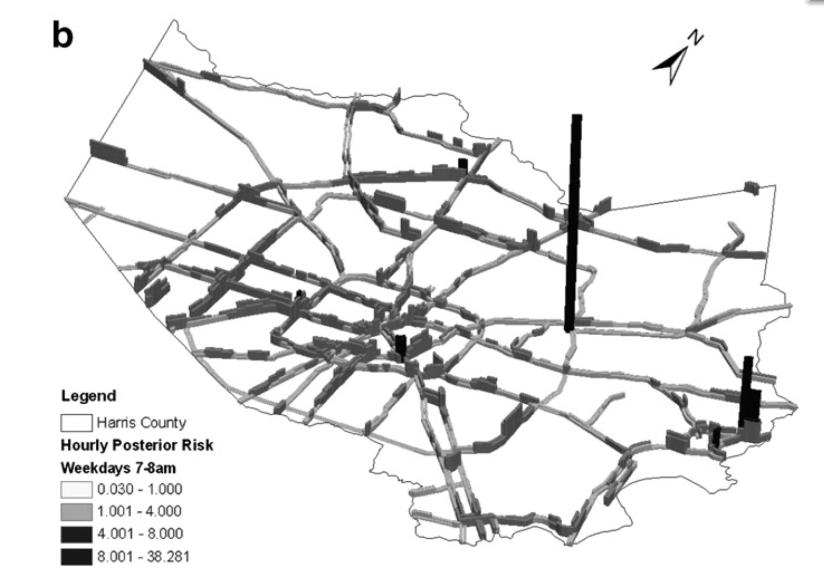
Traffic accidents are very complex events from analysis perspective because there are typically many contributing factors, such as road design, urban structure, culture, environment, socio-economic factors, etc., affecting them spatially. These factors can be completely independent, and spatial and statistical methodologies could identify their relation. GIS offers integration, spatial analysis models, and visualization to enable users to overlay different spatial layers. One of the main gains of spatiotemporal analysis is to detect hot spots or risky areas in urban structures to the accidents.
Such visualization and models will improve safety and helps with the proper allocation of resources to improve network safety. A hot-spots spatiotemporal analysis will visualize the vulnerable segment of the traffic network. Hot spot analysis is the first step in road safety improvements. It allows preventative measures and maintenance for hotspot locations, ensuring efficient, safe, feasible, and faster transportation.
References
Liu, S., & Zhu, X. (2004). Accessibility Analyst: An Integrated GIS Tool for Accessibility Analysis in Urban Transportation Planning. Environment and Planning B: Planning and Design, 31(1), 105–124. https://doi.org/10.1068/b305
Li, L., Zhu, L., & Sui, D. Z. (2007). A GIS-based Bayesian approach for analyzing spatial–temporal patterns of intra-city motor vehicle crashes. Journal of Transport Geography, 15(4), 274–285. https://doi.org/10.1016/j.jtrangeo.2006.08.005
Le, K. G., Liu, P., & Lin, L.-T. (2020). Determining the road traffic accident hotspots using GIS-based temporal-spatial statistical analytic techniques in Hanoi, Vietnam. Geo-Spatial Information Science, 23(2), 153–164. https://doi.org/10.1080/10095020.2019.1683437
Ng, K., Hung, W., & Wong, W. (2002). An algorithm for assessing the risk of traffic accident. Journal of Safety Research, 33(3), 387–410. https://doi.org/10.1016/S0022-4375(02)00033-6
Bíl, M., Andrášik, R., & Sedoník, J. (2019). A detailed spatiotemporal analysis of traffic crash hotspots. Applied Geography, 107, 82–90. https://doi.org/10.1016/j.apgeog.2019.04.008


Be the first to comment