
The Virtual Subsurface Utility Mapping Strategy Forum Conference 2022 presents a panel on developing a subsurface digital twin for Canada
Did you know that the annual estimated cost of infrastructure damage that occurs during excavation work in Canada is around $1 billion dollars? Join us for the free panel Developing a subsurface digital twin for Canada on March 22 at 4:00 pm EDT to learn more about developing a subsurface digital twin to improve the damage prevention of infrastructure in Canada.

You can register for free at: https://sites.grenadine.co/sites/gogeomatics/en/sumsforum/register
Innovative atlas puts Indigenous knowledge on the map — literally — to help tackle climate crisis
The Climate Atlas of Canada has added an indigenous knowledges section to their interactive atlas. Hetxw’ms Gyetxw, who grew up on Gitxsan territory in British Columbia, leads this project along with the University of Winnipeg together with Indigenous communities. The atlas shows climate data from Inuit, Métis and First Nations communities, videos from Indigenous knowledge keepers and elders, and Métis climate change mitigation projects that focus on environmental conservation and protection. The old version of the atlas did not include climate change projections for Indigenous communities, however, the atlas now includes climate change projections for 53 Inuit communities and 634 First Nations communities. The new atlas also features Métis mitigation projects that aim to reduce greenhouse gas emissions and climate change adaptation projects such as the Métis wildland firefighters.

Article can be viewed here
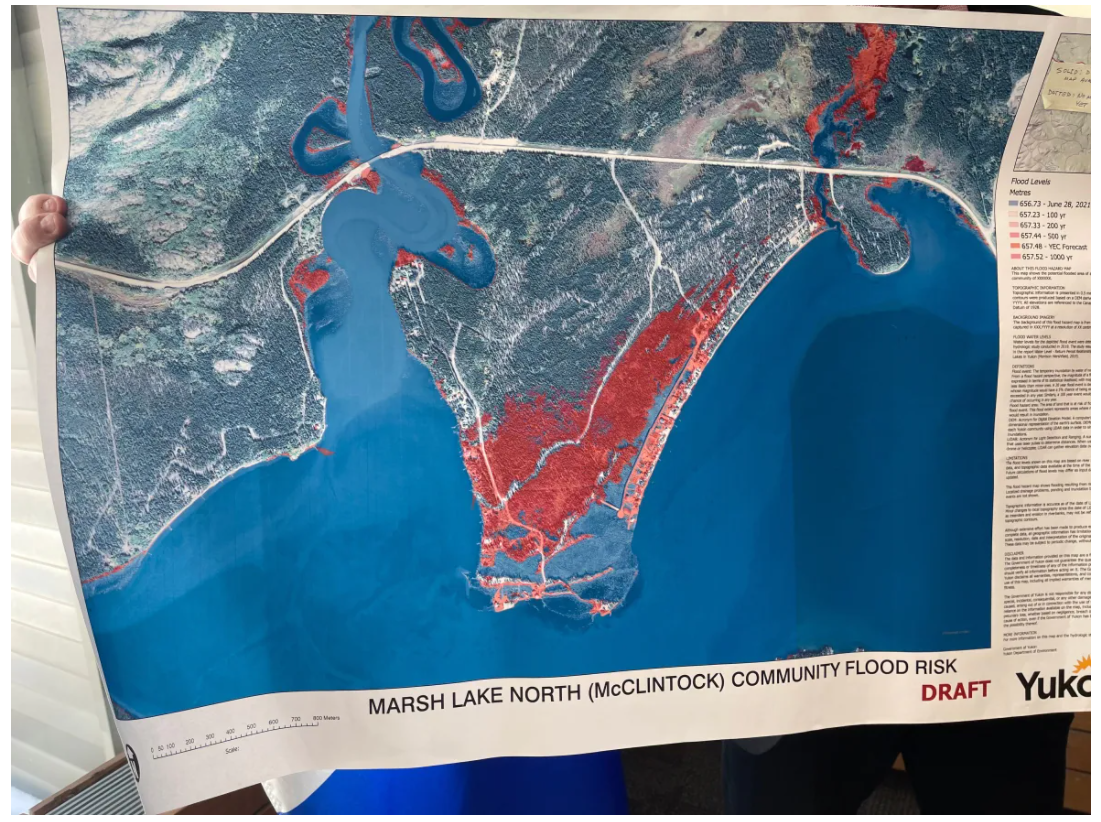
Yukon government mapping all flood prone areas, minister says
A few regions in the Yukon were devasted by record floods last year. The Yukon government is now mapping these areas to see how far the floodwater reached to better prepare for further flooding and to adapt to climate change. The Community Services Minister of the Yukon has said that they have put aside $1.5 million dollars for floodplain mapping. The government is also looking into permanent solutions such as infrastructure upgrades to adapt to future flood events.
Article can be viewed here
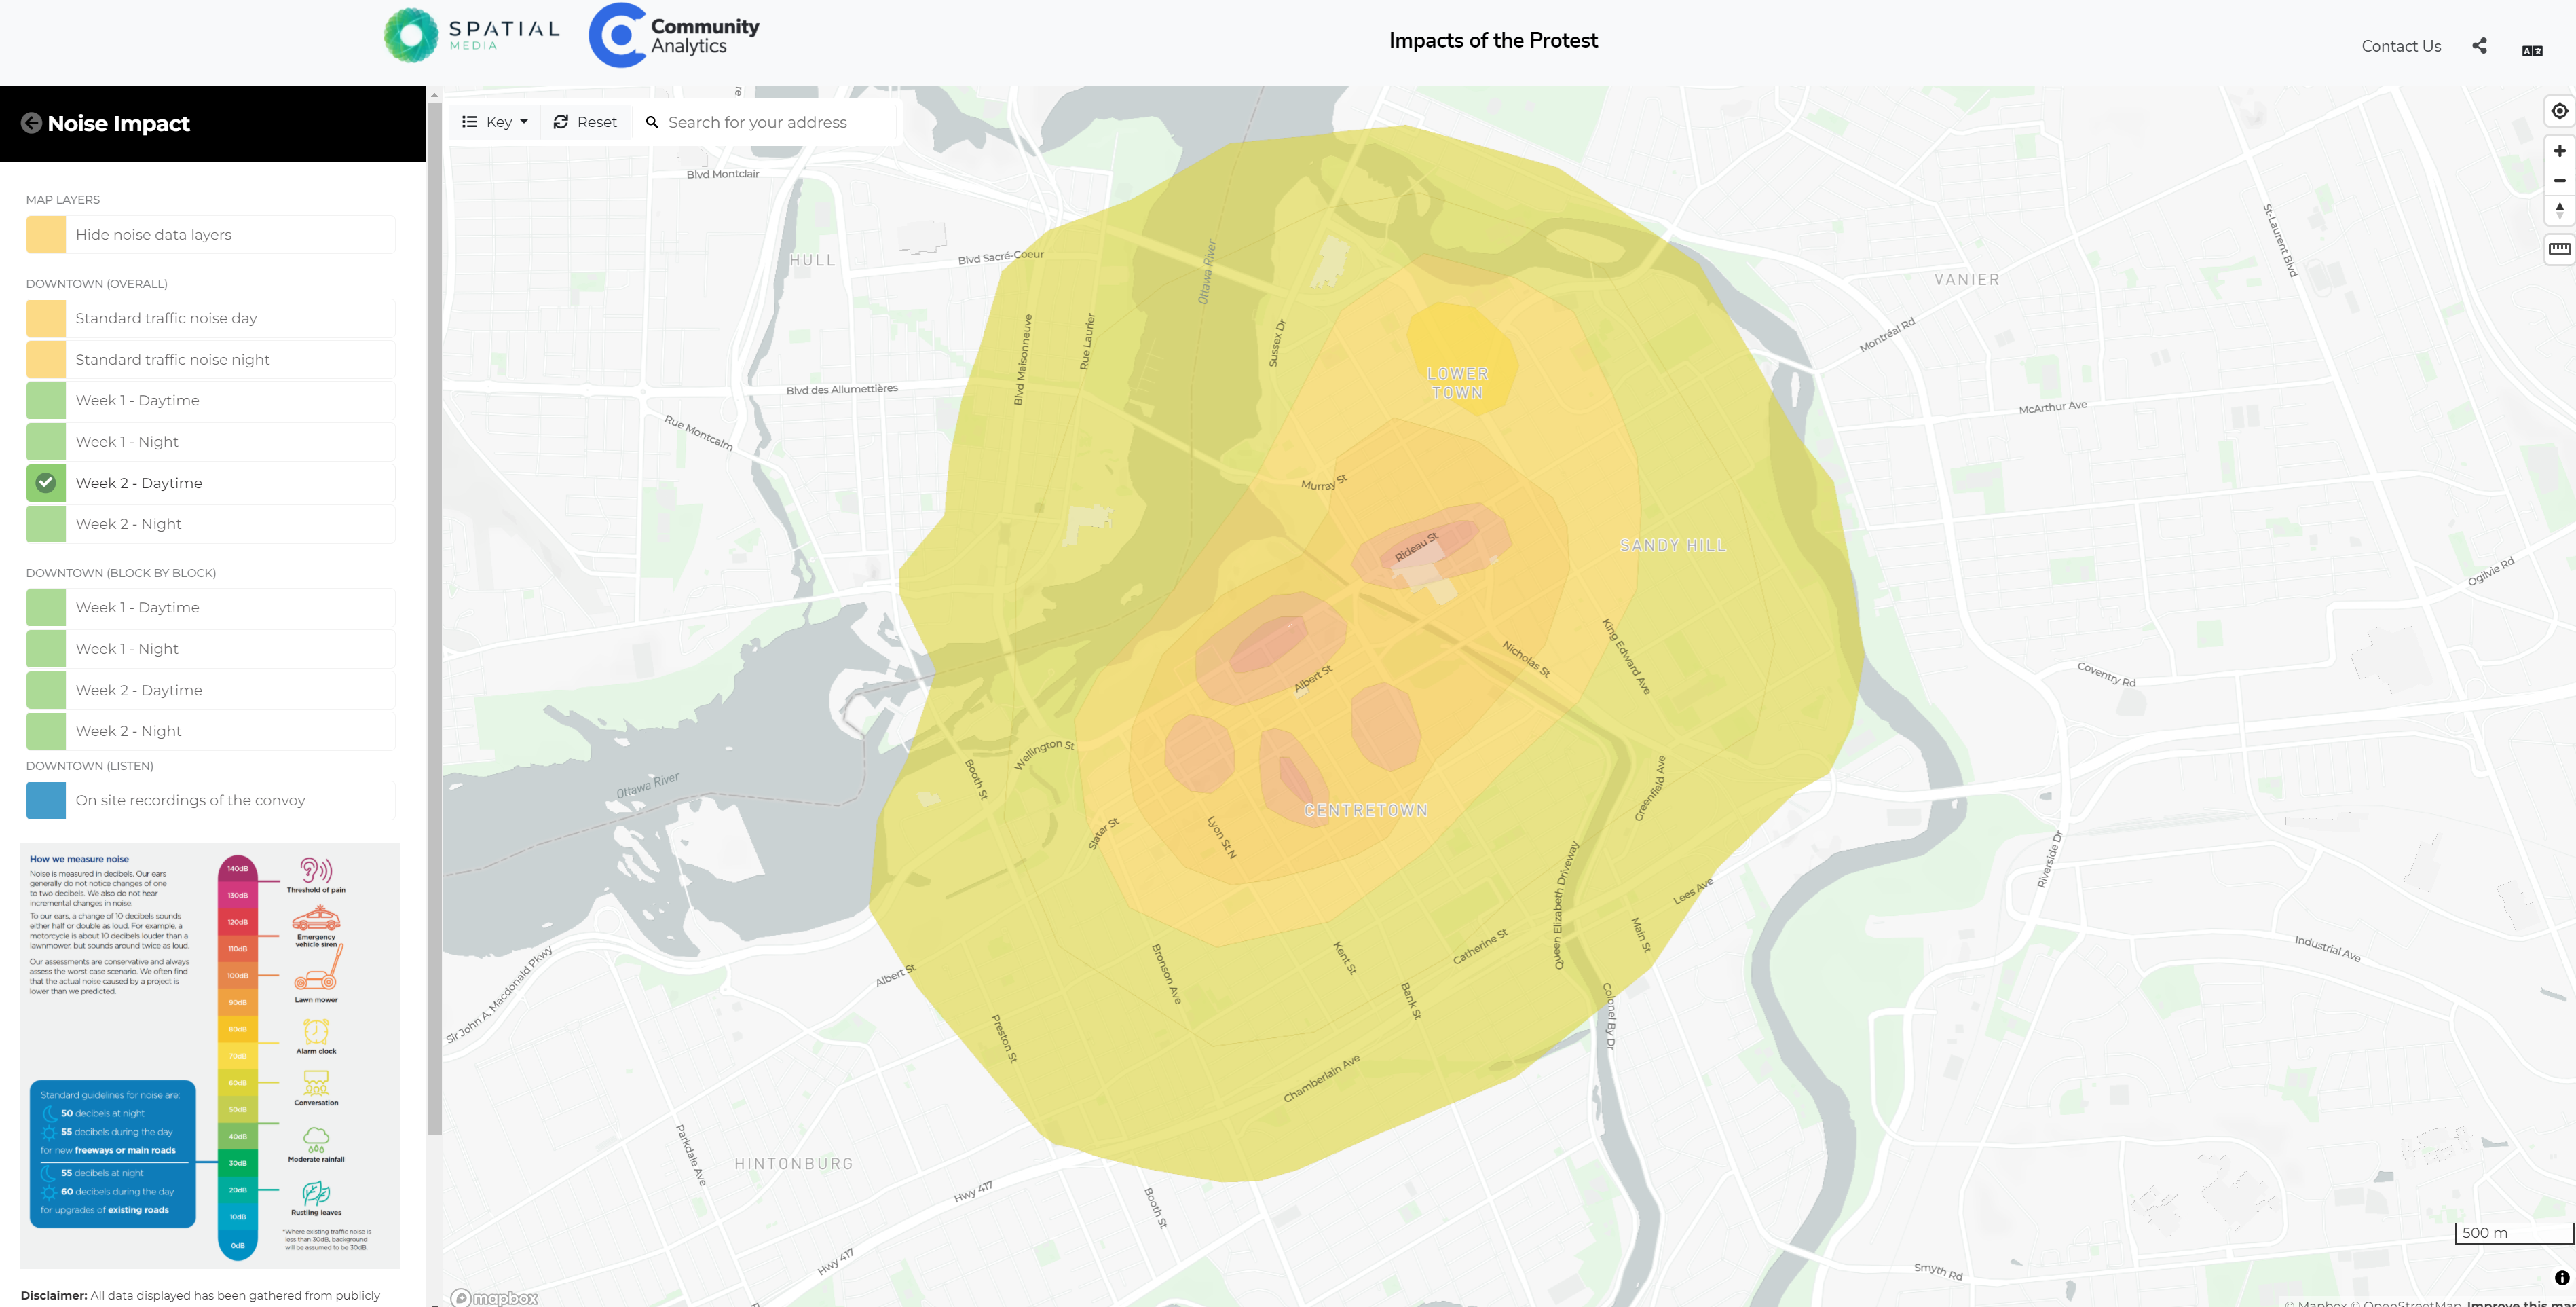
Interactive map shows environmental impact of Ottawa trucker protest
This interactive map created by Spatial Media, shows the environmental impacts during the trucker protest in Ottawa last month. This map allows users to see the noise impact, air quality impacts and traffic closures during week one and two of the protest. You are also able to compare noise levels with common noises heard in our environment, for example, the noise in some areas of downtown Ottawa were similar to the noise a consistent lawn mower would make. The Air Quality measurement in some areas of the city reached 32% higher than the World Health Organization guidelines. Finally, as for traffic closures, the map shows that many of the streets in the downtown core were closed or inaccessible.
Article can be viewed here
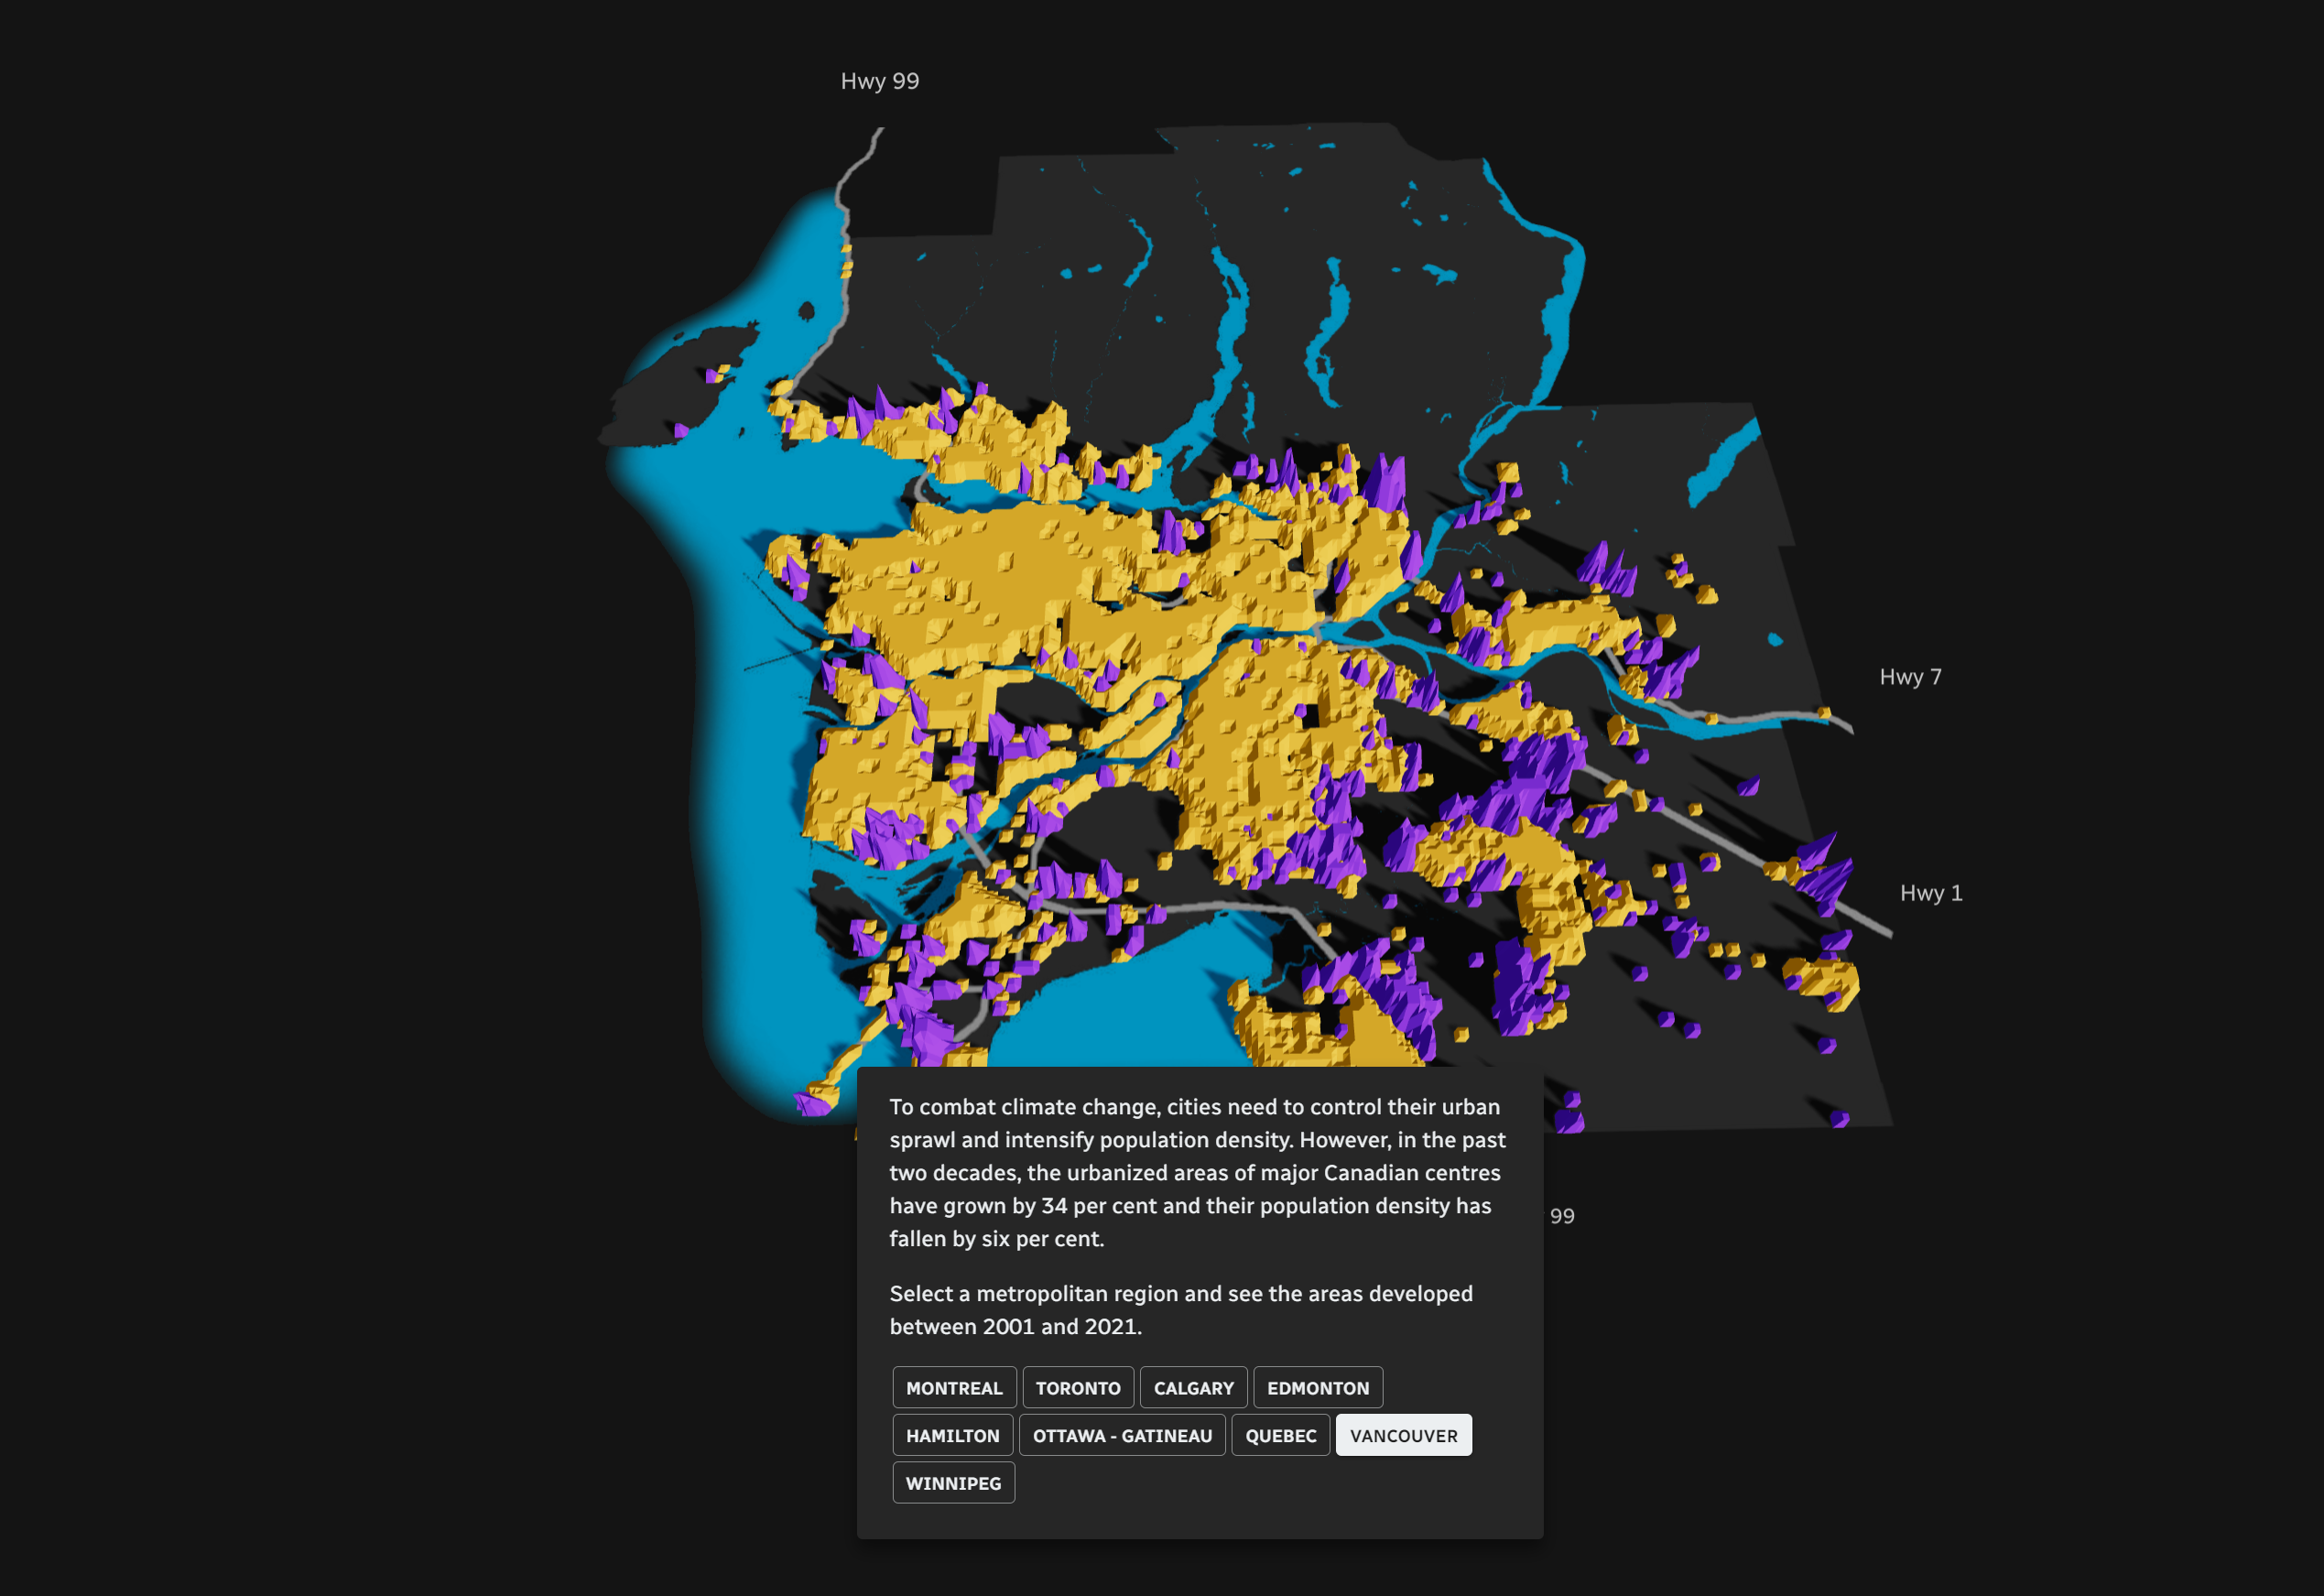
We used AI to measure Canada’s urban sprawl
Artificial intelligence was used to measure urban sprawl in Montreal, Toronto, Calgary, Edmonton, Hamilton, Ottawa-Gatineu, Quebec, Vancouver and Winnipeg. They measured population, surface area and density of these major cities and found that since 2001 Canadians are occupying more space outside of city centres. They use a 3D map to display the data to give you a real sense of the population change in a particular region. For this project they used maps from Natural Resources Canada, artificial intelligence, and satellite imagery to spot where the urban areas were. They also compared the use of vehicles, transit, cycling and walking from high to low amenity-dense areas.
Article can be viewed here
Be the first to comment