
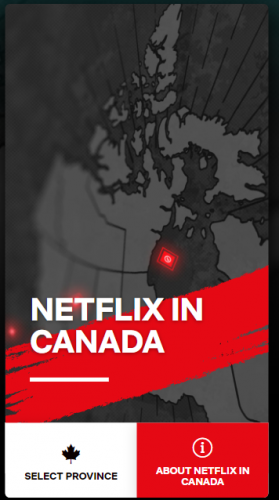
Netflix Canada launches website showing its filming locations across the country
Netflix in Your Neighbourhood will allow users to search for filming locations by searching for a film or series title or by province and will also feature directions to filming locations. Canadian filming locations are displayed on a map. It also tells you what episodes were filmed at the location, and things to do at the location if you decide to make the trip.
https://dailyhive.com/vancouver/netflix-canada-filming-locations-website
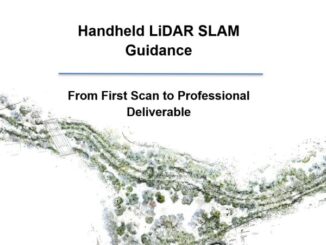
How Lim Geomatics is using new technology to change an old industry
As a PhD student at Queen’s University about 20 years ago, Kevin Lim began researching a new method to survey forests with lidar. Lim’s thesis was the basis for the company he founded in 2006. Lim Geomatics, based in Ottawa, now has 21 employees and a suite of software products to help forestry companies manage their operations and provide accurate data on forest inventories, right down to the height of trees.
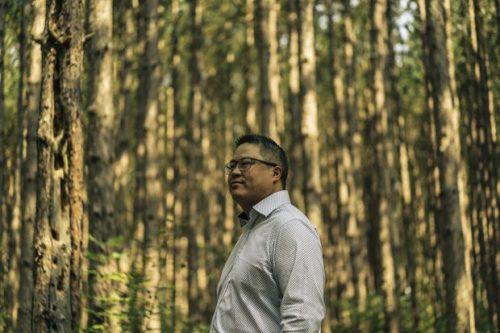
Lim endured skepticism when he first sought to bring lidar to foresters. The industry, he says, is hesitant to adopt new technologies. Lately, he has been focused on building the company’s marketing team and experimenting with ways to get the word out, even launching a podcast earlier this year about foresters adopting digital technology.
Student-built dashboard aims to more accurately track global COVID-19 infections
Confirmed cases of COVID-19 have been tracked closely throughout the pandemic – but they represent only a fraction of the total number of people who have been infected by SARS-CoV-2. That’s why Tingting Yan, a master’s student at the University of Toronto’s Institute of Health Policy, Management and Evaluation (IHPME) at the Dalla Lana School of Public Health, decided to create SeroTracker with Rahul Arora, a Rhodes Scholar and PhD candidate in biomedical engineering at the University of Oxford.
The online tool aims to more accurately depicts global COVID-19 infections by tracking serology tests that look for COVID-19 antibodies in a person’s blood, which indicates a prior infection or vaccination.
The dashboard monitors and synthesizes studies from governments and research organizations to track seroprevalence data – the percentage of people in a population who have SARS-CoV-2 antibodies. The platform visualizes antibody estimates on a map and allows users to compare differences in past exposure between countries, demographic groups and occupations.
The Public Health Agency of Canada and the World Health Organization used the platform to develop global models of disease spread. The Bill and Melinda Gates Foundation looked at SeroTracker data to guide investment in serosurveys in low- and middle-income countries. Publications such as The Economist referenced the website to estimate excess deaths from COVID-19, while the New York Times examined the site’s seroprevalence data to look at the true toll of the pandemic in India.
Yan and her team are now looking beyond COVID-19 to determine how the platform could be used in other scenarios involving different diseases. They recently received a grant from the Canadian Medical Association Joule Innovation Fund to work on machine learning algorithms that can predict whether an abstract will be included in a search to make the process more efficient.
From “Wet End” to “Coquitlam Island”: New map shows the future of sea-level rise in BC
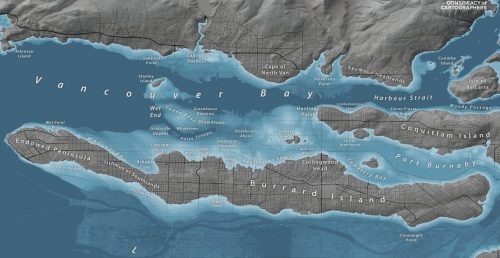
Jeffrey Linn, the artist behind the engaging map that is creating conversations around how rising sea levels will affect where Vancouverites will live.
All his sea-level rise maps show what it would look like when all the ice sheets in the world have melted 1,000 years in the future.
https://dailyhive.com/vancouver/vancouver-sea-level-rise-map
Apple Maps with 3D View Coming to Montreal, Toronto, Vancouver in 2022
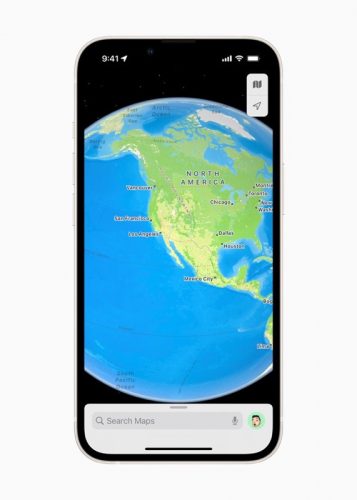
Apple recently announced a new update for Apple Maps in iOS. A new 3D view is now available in London, Los Angeles, New York City, and San Francisco.
Canada will be getting the feature next year for just a few select cities. Apple says the new Apple Maps with 3D view will launch in Canada in 2022, first in Montreal, Toronto, and Vancouver. Earlier this year, Apple announced its Maps teams were walking around these three cities with special backpacks to record data.
Their goal has always been to build the best and most accurate map in the world.
Event: Open Data for Rural Communities: Measuring Access to Services
Statistics Canada, together with the Centre for Rural Economic Development (Infrastructure Canada), are pleased to present a new Workshop Series on “Measuring Access to Services: International and Canadian Experiences in Rural Analysis”.
This workshop is one of a series of strategic discussions aimed at expanding our collective knowledge through concrete examples, across Canada and internationally, on the use of data for rural and regional policy analysis.
Event Date: Wednesday October 13th, 2021
Time: 10:00 am – 12:00 pm ET
Register now: https://sites.grenadine.co/sites/gogeomatics/en/stats-canada-training/home
Be the first to comment