
Every summer in British Columbia, along with long days, sunshine, heat, and little rain comes an all-too-familiar reality: hundreds of wildfires.
Some of them affect only uninhabited regions in BC, but many threaten communities, property, pets, livestock, and human lives. During the fire season it is critical that accurate, relevant and adequate fire information be available to the public.

People affected by wildfires need to get information quickly. These people include residents in evacuation areas, travellers, municipal government personnel, and emergency crews. Unfortunately, there are many sources of fire-related information which require combining in order to get many of the answers you might need. In British Columbia, some of the key resources available are:
- The BC Wildfire Service, which provides an Active Fires Map;
- DriveBC, which has a Highway Conditions map;
- EmergencyInfoBC, which provides evacuation order and alert information;
- Google Maps, which provides live traffic information; and
- Finally, news and media sources, which provide related stories and updates.
A Need for a Better Fire Map

When Neil Johnston of Vancouver, BC, tried to determine a safe route south for his parents he became frustrated. His parents had been evacuated from their home near Soda Creek, north of Williams Lake, and he became disheartened having to flip between many scattered sources of critical information. He needed answers fast, all in one place, and he was flipping between three major data sources on different browser tabs and trying to correlate the data. It was this frustration that inspired him to create Mobile BC Firemap Plus, a GIS integrating many key fire-related datasets together in a useful format.
From Google Maps to ArcGIS Online
The variety of resources available to Neil, including social media, Google Maps, and ArcGIS Online, allowed him to come up with a Fire Map solution in an attempt to help his evacuated parents find a highway route south away from the fire-burned regions of BC to Neil’s sister’s place in Chase. On Sunday, July 9, upon learning of his parents’ evacuation, Neil examined the available data online and realized there wasn’t a viable south route that they could take at that time. His parents were forced to travel over 80 km north to Quesnel for the time being. That day, while his parents were en route to Quesnel, he built a web map over a couple of hours to help them navigate fires and road closures while evacuated and to return home afterward.
His Web Mapping tool was originally built using the Google Maps API, Open Data, and his coding skills. Because Neil’s company, Echosec, has access to ArcGIS Online, Neil then decided to take advantage of this powerful resource to improve his web map and make it available to many people affected by BC wildfires. Delivering a reliable data source in a timely fashion to users was a top priority, and ArcGIS online can take in Open Data rapidly, which makes it ideal for this use. On July 10, Neil spent the day learning to work with ArcGIS Online’s templates and features to create a web map, initially called BC Firemap Plus, which has been hosted by Echosec. Being new to this technology, he used default templates.
Once the map was created, he got requests for a mobile-friendly version, so on July 13 he used ArcGIS’ WebAppBuilder to create a mobile app for the GIS where he was able to incorporate widgets such as location, and to customize pop-ups and the presentation of data.
Map Improvements
After listening to CBC radio’s call-in coverage of wildfires, Neil realized another sought-after parameter was wind data, which he added (as well as live traffic data) from ArcGIS Online Living Atlas. The wind data within the GIS is not very extensive, but he has incorporated the best available open data that he could acquire.
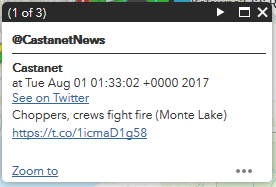
Social media content was then incorporated into the GIS. Mike Anderson, the COO of Echosec, incorporated Twitter posts from channels of both formal and informal organizations (examples: Vernon Morning Star, My Prince George Now, BC Wildfire Help, WTH Did I Just See?), and also relevant posts from individuals, into the application. This provided users with an extra layer of information and news updates (for example, “Wildfire breaks out near Monte Lake” was tweeted from Vernon Morning Star on July 27), painting a clearer picture of the fire situations for evacuees and people on the ground.
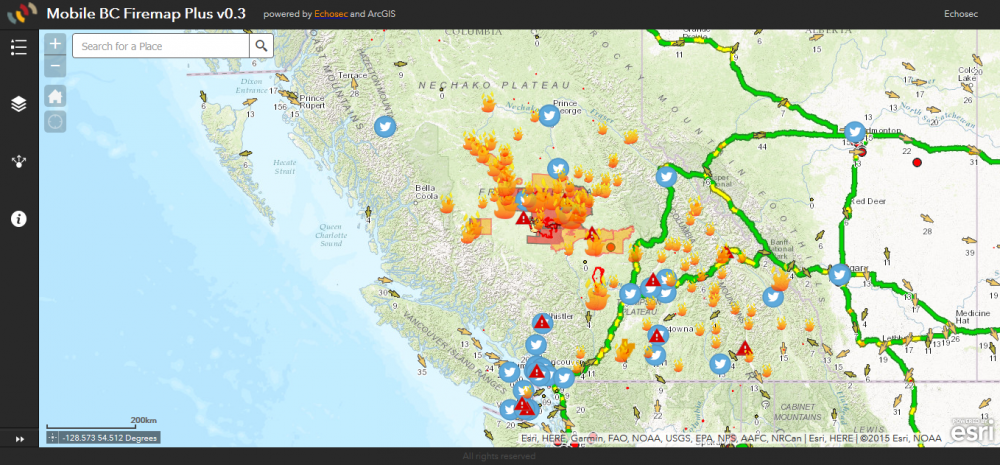
Mobile BC Firemap Plus
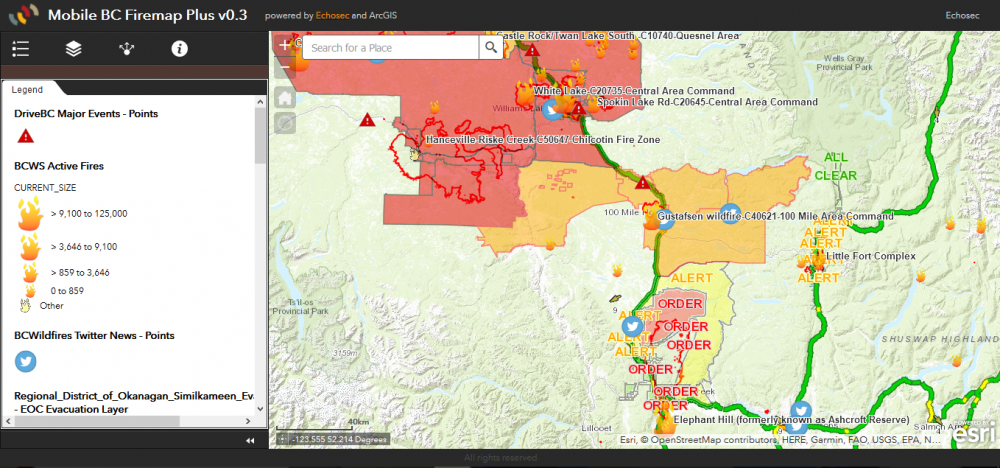
The final GIS product allows the user to see various wildfire features for the entire province of British Columbia at a glance on both desktops and mobile devices:
- Active wildfire perimeters
- Evacuation alerts and orders
- Highway alerts
- Wind conditions
- Traffic flow
- Lightning strike density
- Highway cameras
- Evacuee reception and comfort centres
- Smoke forecasts
- Fire-related Tweets
Mobile BC Firemap Plus directly incorporates and displays data straight from the sources (with some data manipulation where needed) and is a very good example of the principles of GIS and the many ways in which multiple datasets can be assembled and applied efficiently and effectively.
The data on the map updates dynamically by setting the refresh frequency on each layer in ArcGIS Online. The most critical information such as evacuation alerts and orders is refreshed every 5 minutes, and other less important information is updated less often. The refresh frequency settings are constrained by how often the source datasets are updated, by accounting for avoiding overwhelming the source data servers, and also by accounting for internet traffic of end users. For example, the fire perimeter data is only updated around midnight daily, so the update frequency is set accordingly. The NASA updates its fire data every 12 hours and helps with providing clarity of the advancing fronts of the fire, so the update frequency for this dataset is every 6 hours.
The map is incredibly useful for anyone who is affected by wildfires directly or indirectly, or travellers trying to plan routes around closed sections of highways.
Open Data Sources
Whenever an Open Data endpoint was available, a dataset was directly included as a layer in the map. For Open Data that was not geolocated or map-friendly (such as ESS Evacuation Reception and Comfort Centres and Food Banks), Google Sheets was used as a data container, and a geolocating script was used to transform resource locations into latitude and longitude coordinates that can be mapped by ArcGIS online. A table of data sources is provided at the end of this article.
Social Media Data
Social media data was processed before incorporation into the GIS. After a geographic social media search was conducted, Twitter data was fed into a Node.js micro service that converts the results to GeoRSS. The search contained a white and black list of terms and individuals and geographical bounds to ensure the quality of the data.
Project Challenges
Neil states that the most difficult part of the project was sourcing the data in a consumable format. While the Cariboo Regional District and the Thompson-Nicola Regional District have evacuation order and alert information available online, it was not an easy task to find the data sources for incorporation. Another challenge was that the BC Wildfire Service moved their Active Wildfire map to ArcGIS online in order to accommodate heavy internet traffic, so the data endpoint changed, and the new data source needed to be found quickly. In the end the change in sources for this dataset was beneficial because the source data was already presented visually in a suitable form. NASA was incredibly difficult to navigate in terms of finding satellite endpoints, as its web pages are text-heavy and information is difficult to find.
Fire Map Maintenance for 2017 and the Future

While Mobile BC Firemap Plus did not help Neil’s parents initially find an open route south away from their home, it was helpful in navigating road closures and providing fire-related information. After spending a week in Quesnel, they were able to take a long detour route over 700 km long first north to Prince George and then southeast through McBride to get to Chase. They later returned home to Soda Creek after the evacuation order was lifted, using the GIS to guide them.
Neil and Echosec are dedicated to maintaining this map for the 2017 fire season. Neil has pointed out that future improvements to such a map include a layout that prioritizes the needs of mobile users. Customization can be added to improve usability, such as combining the Legend and Layer Management tabs, improving touch areas (particularly for these two tabs), and reducing the number of clicks between touching a feature on the map and the pop-up generated from it.
In terms of future wildfire map services, he feels a consolidated fire map such as the one he created should be the responsibility of Canadian and American provincial/state governments, and they should be the ones to take initiative in this area rather than the private sector, given the ongoing and increasing demand for this kind of data presentation in map format (as climates get warmer and fire seasons get worse).
Data sources used in the map:
| Open Data | Source |
| Recent Satellite Lightning Strike Density (Emulated) | NOAA/National Weather Service |
| National Weather Service Smoke Forecast | National Weather Service Smoke Forecast |
| NASA VITUS 375m – FIRMS | NASA FIRMS WMS VIIRS Fire/Hotspot |
| NASA MODIS 1km – FIRMS | NASA FIRMS WMS C6 MODIS Fire/Hotspot |
| Fire Perimeters | DataBC |
Evacuee Resources:
| Open Data | Source |
| FoodbanksBC.com | Google sheets published CSV of FoodbanksBC |
| Evacuee Comfort Centres | Google sheets published CSV of Evacuee Comfort Centres |
| Evacuee Reception Centers | Google sheets published CSV of Evacuee Reception Centers |
| Highway Cams | DriveBC |
| DriveBC Major Events | DriveBC |
| DriveBC Normal Events | DriveBC |
| Evacuation Zones: Cariboo Regional District | Cariboo Regional District |
| Evacuation Zones: Thompson-Nicola Regional District | Thompson-Nicola Regional District |
| Wind Conditions | ArcGIS Online Living Atlas |
| Live Traffic: ESRI | ArcGIS Online Living Atlas |
A recent news article on the map is available from Penticton Western News.
Echosec’s Web Site:
![]()
![]()
About Neil Johnston
Neil comes from a programming background and learned GIS through his work. Previously Neil worked as a software developer for CloverPoint. There he was part of a team that developed two applications, one for Land Title Rights Managements, and the second for Cemetery Management. CloverPoint relied heavily on GIS for the framework of their work, which provided a golden opportunity for Neil to learn about Web GIS while working with GIS technicians and writing code to incorporate mapping into web applications.
Today Neil works for Echosec, a social media data monitoring and analysis service for businesses as the Director of Product Design. There, he focuses on the data visualization of applications and usability of spatial social media searches while still incorporating coding to a large extent.

Neil Johnston can be reached at [email protected].


Be the first to comment