
Get Your Bike and Beat the Heat: Ottawa’s Cool Map of Cycling Routes Overview
In the winter of 2020, the City of Ottawa embarked on an innovative research project in collaboration with the University of Ottawa’s internship program. The goal was to create an integrated map that would show the heat stress levels of cycling routes in the city. The researchers wanted to assess how different features such as temperature, slope, and shade might affect residents’ physical activity levels and their decision-making process when choosing a cycling route.
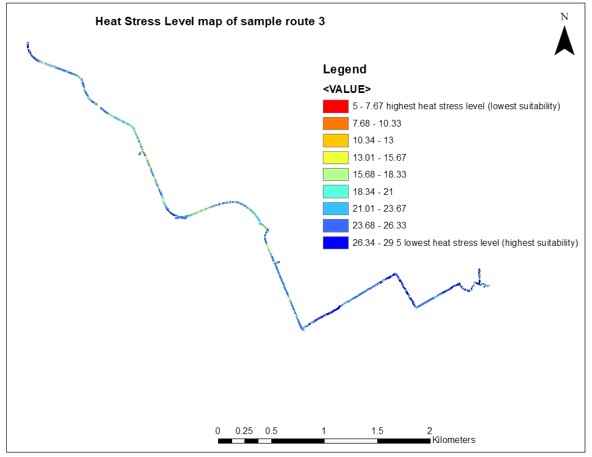
The study focused on five sample routes, but the methodology used can be applied to Ottawa’s entire cycling network in the future. The final map is a useful tool that can guide transportation planning for the city by identifying existing and future “shade corridors” for pedestrians and cyclists, prioritizing tree planting efforts.
Creating a Heat Stress Map of Ottawa’s Cycling Routes: What You Need to Know
The research findings suggest that three factors – topography, shaded areas, and temperature (which is affected by the Heat Island Effect) – have an equal impact on the results. This means that these factors are weighted equally in the process. However, this weighting system can vary depending on the purpose and objectives of the project.
To create the map, the researchers used a range of data and rasters, including DSM (Digital Surface Model) of Ottawa to extract slope maps, Landsat images to extract temperature data and account for the Heat Island Effect, and information about tree canopies around the selected cycling routes.
The researchers applied a suitability analysis to support decision-making around cycling paths. They used the Index Overlay Method, which is one of the most common methodologies in multicriteria issues like site-suitability analysis. They intersected different levels of rasters and data in GIS to produce a suitability analysis that would determine the best or most desirable locations for the ideal path out of the five sample routes in heat events.
To create the Index Overlay, they used the “Weighted Sum” tool in ArcGIS software. This required standardizing the data since the different types of data (e.g. slope in degrees, Landsat values in degrees Celsius, and tree canopies in meters) required scoring data to make them comparable and able to be weighted. The advantage of this approach is that it is subjective, so users can change the classification based on different purposes.
For the Landsat images, they used the natural breaks method (Jenks) to classify the values based on naturally existing breaks in the data. This approach helped to identify temperature classes with a more meaningful visualization of the map data, and it showed classes whose boundaries are set where there are relatively big differences in the data values. For slope, they manually classified the data into five classes based on a literature review that identified the slope values that cause rising human effort for cycling. For tree canopies, they manually classified the data based on previous studies that showed the farther the trees, the less shade they have on the routes.
The researchers weighted all the data equally for the purpose of the study. However, the weighting can be adjusted based on the specific goals of the project.

The final result is a map that shows the level of heat stress along each cycling route. This information can be used for tree planting, with the first and second routes identified as needing more trees along the way.
Looking to the future, GIS can facilitate models by providing digital geo-data and displaying intermediate and final results. However, usually, these computer models are implemented as stand-alone software because some data, such as tree canopy maps, are not updated online, and they are updated once in a while. Therefore, achieving the most appropriate result requires collaboration among many stakeholders, finding the latest updated data and using spatial-temporal data that shows changes over time.
In conclusion, this research project has provided a valuable tool for transportation planning in the city of Ottawa. Also, by identifying the heat stress levels of cycling routes, it can guide decision-making around tree planting.


Be the first to comment