To properly and effectively design and manage the city’s tree canopy it is important to quantify the amount and composition of existing vegetation. Knowing this baseline information provides a benchmark for identifying tree canopy targets and to better plan priorities if improvements are deemed necessary. At the very least, this baseline information can determine how much tree canopy the city has and how much tree canopy can the city potentially have. Furthermore, it is important to determine local geographic variations (e.g., differences between neighbourhoods, wards, etc.) to properly target any necessary interventions (such as tree planting programs) and to optimally allocate resources.
The methodology for quantifying vegetation highly depends on what scale the quantification is conducted. The following discusses the different methods of collecting baseline tree canopy data based on the scale that the data is needed for.
Large scale, detailed tree inventory
More detailed, large-scale projects are often done by conducting a field-based approach involving the inventory of each individual tree. This is typically done using a GPS-enabled device and manually entering the geographic location of each tree. Additional attributions (e.g., species, tree height, circumference, etc.) can be included in the inventory. The inclusion of the geographic locations of each tree is important since it allows mapping and spatial analyses within a Geographic Information System (GIS).
Another method for conducting an inventory of individual trees is the use of air photos and high resolution satellite imagery. Traditional air photos typically have enough resolution to be able to determine tree species. Digital air photos can be used within a GIS and which allows the collection of geographic locations. High resolution satellite imagery (better than 1-meter resolution) such as GeoEye-1, IKONOS, WorlView-1, Quickbird are also available for detailed tree inventory. Both these methodologies would require expert photo interpreters to identify tree species and to collect additional attributes such as tree height.
An advantage for conducting an inventory of individual trees is that it allows the determination of a dollar value for the beneficial environmental and aesthetics effect of trees. This can be done by using a freely available software called i-Tree Streets developed by USDA Forest Service (http://www.itreetools.org/streets/index.php).
Smaller scale, land cover maps
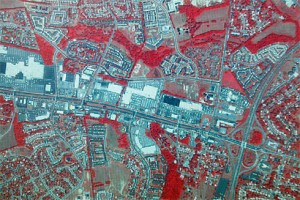
The biggest disadvantage of conducting large-scale, highly-detailed tree inventory is the cost. However, important baseline data can still be collected at a smaller scale which involves looking at trees at an aggregate level (forest or vegetation) rather than at an individual tree level. This can be done by creating land cover maps using air photos and satellite imagery at medium-resolution (e.g., Landsat, SPOT) or high-solution (e.g., GeoEye-1, IKONOS, WorlView-1, and Quickbird). See figure 1 below for an example of satellite imagery viewed in the infrared band.
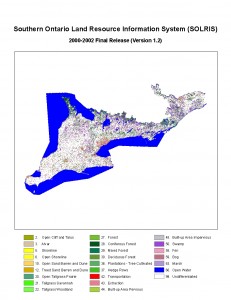
A land cover map depicts the observed physical and biophysical features that cover the surface of the earth. Features include the vegetation (natural and planted) and human constructions. A land cover map is created using a specific classification scheme. Examples of land cover classification schemes include the National Land Cover Data (NLCD) used in the US and the Ecological Land Classification (ELC) for Southern Ontario. The ELC contains classes such as Forest, Tallgrass Woodland, and Coniferous Forest. This classification scheme was used create the Southern Ontario Land Resource Information System (SOLRIS) (see figure2 below).
The process for creating a land cover map using air photos or satellite imagery typically involves the use of manual or automatic methods. Manual methods involve an air photo interpreter visually identifying and manually delineating the boundaries of the different land cover classes. The automatic method involves the application of a supervised and/or unsupervised algorithm according to the specific classification that is used. This is an iterative process and is concluded when the “best” classification has been extracted from the data. Other classification techniques, such as segmentation, have been developed to further refine the resulting land cover map.
The accuracy of a land cover map is assessed by comparing “ground truth” data points to the same location on the land cover map. Ground truth data are points collected in the field using a GPS wherein a specific (or true) classification for that point is identified. For example, a ground truth point may be determined as being in the forest class. This specific point in the resulting land cover map is then checked if it is also classified as forest.
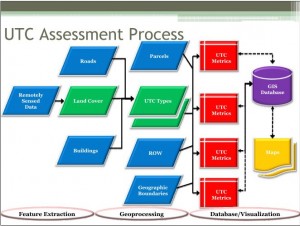
An example of an effective use of land cover maps is the use of the Urban Tree Canopy (UTC) assessment (http://nrs.fs.fed.us/urban/utc/about/). The UTC uses very high resolution aerial imagery to create land cover maps (with classes such as trees, low lying vegetation, water, impervious, etc.). The resulting land cover maps are spatially explicit (i.e., tied to location information) therefore it is possible to integrate it with existing planimetric GIS data such as buildings, roads, rights-of-ways, etc. This integration is important because it makes it possible to assign UTC types (Possible UTC, Existing UTC, Not Suitable UTC) to the different land cover classes. Grass areas, areas with low-lying vegetation, and bare soil can be categorized in the Possible UTC. Buildings, roads, and water classes can be categorized as Not Suitable UTC. Areas that are categorized as Existing UTC include those that are forested as identified in the land cover map. Figure 3 below shows an overview of the process of conducting a UTC assessment.
A fast and relatively cost-effective method for creating a land cover map involves the use of regularly spaced grid of dots overlain on a high-resolution aerial imagery (air photo or satellite imagery). Google Earth imagery can be used in this method. Photo interpretation techniques are then utilized to identify what land cover class each of the point belongs to. This method can be done quickly (~ 1000 pts/day) and accuracy of the land cover map can be improved by decreasing the grid spacing between points. Since it is relatively quick to do it is possible to compare multi-date imagery in order to detect any changes in the land cover between multiple time periods. The disadvantage of this method however is that it does not result in a very detailed map (but might be suitable depending on the purpose of the project). The accuracy depends highly on the ability of the photo-interpreters. It is essential that photo-interpreters undergo proper training and quality checking protocols are implemented. Figure 4 shows an example of the dot grid method with the dots overlain on high resolution aerial imagery.

For my next blog post I will talk about a specific project that I helped initiate and that uses the dot grid method to quantify tree canopy cover within the urban boundary of the City of Ottawa.


Be the first to comment