

My COGS GIS Education, Part II
In my first article, I introduced the how and why I chose to attend COGS from the fall of 2014 to spring 2016. In Part 2, I wanted to give some insight into the first-year courses, and the faculty that teaches at the Centre of Geographic Sciences. The goal is to show how the foundation year for the Geographic Sciences program would help a student decide on a concentration for their second year. Some students go into the program wanting to be Planning Technicians, but end up changing to another concentration based on what they experienced in the foundation year. Information about the program can be found at NSCC-COGS.
The Course Load:
As mentioned in part one, the year is broken into two semesters with 15 weeks of instruction. It can be a fast and sometimes a bumpy ride. From week 1 to week 15, my first goal was to always keep on top of the course load and to make sure I was always submitting my best work for evaluation. Everybody quickly learned sloppy or incomplete assignments, would lead to poor marks and your ability to finish the next assignment.
In the first Semester:
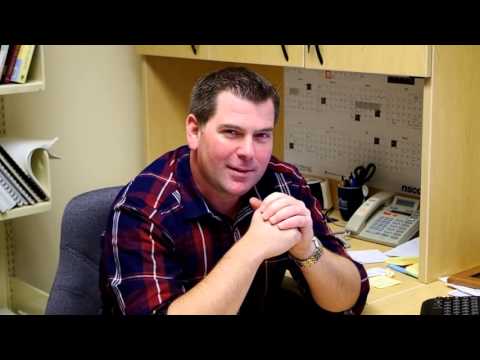
Mark Hebert (© Photo by- NSCC.CA)
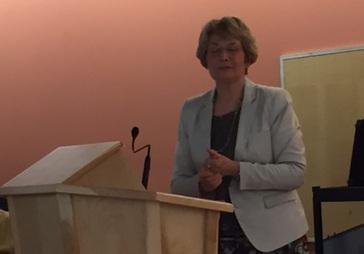
Ela Dramowicz (© Photo by- Monica Lloyd)
Geographic Information Systems I; Students work on the infamous Digby Map. The Town of Digby is about an hour away from COGS, and every year, new students learn the basics of building a GIS to produce a map of the Town of Digby. Week by week we were led through the course exposing us to new concepts and functions of a GIS and how to manipulate the data using Esri’s ArcMap software package and extensions. The structure of the course is half GIS practical and half GIS theory, taught by Mark Hebert and Ela Dramowicz. By week eight everybody one was to have fully annotated and labeled map of Digby. But this is just the half-way point. By the end of the term, we have learned to solve increasingly difficult GIS problems as well as add layers to the Digby Map assignment and produce a series of maps for final submission at the end of the first term. GEOS1200 was ‘the nuts and bolts’ of GIS theory and how to use ArcMap to design maps that met or exceeded industry standards.
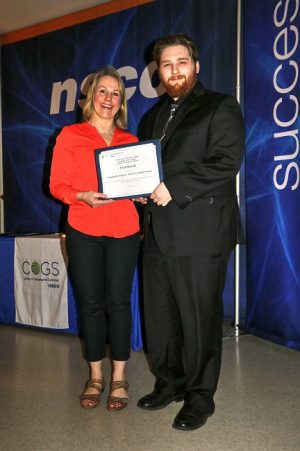
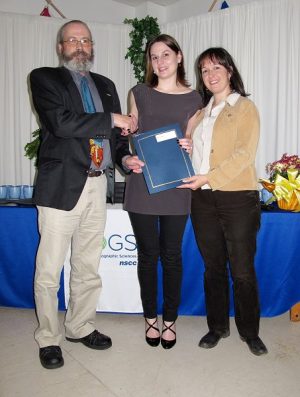
Monica Lloyd giving Evan Brant an award. (© Photo by- Paul Illsley)
Mapping and Geodesy; Monica Lloyd taught students the basics of geomatics, such as map reading, scale, datums, projections, and many other fundamental concepts. Through hands-on examples, we learned how to decide the correct scale and projection for a map. Using handheld Trimble units, we collected GPS data and created a map by integrating the data into a GIS. Monica exposed us to land use mapping, how to use civic address file, and property mapping. In many ways, this course was the first exposure to the vast possibilities of using GIS in real world applications.best dog nail clippers – selfpetcare
Ed Symons taught Environmental Planning; With Ed, we had the pleasure of learning about geology, soils, climate, vegetation, and hydrology. In many ways, Ed is the ultimate environmentalist. His knowledge of watersheds, soils, and climate and how they affect the world was amazing. His goal was to make us think how the environment impacts a GIS. If we were studying watersheds, we would know how the water flowed and if it could cause flooding or soil erosion, based on the watershed that we delineated. If the topic was soil, we discussed the types of soils and what soil would be good for agriculture, woodlands or urban development.
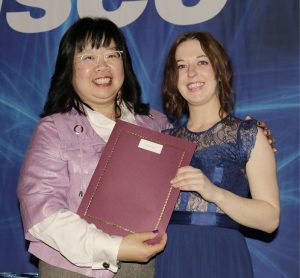
Ada Cheung giving Vanessa Campbell an Award (© Photo by- Paul Illsley)
Introduction to Cartography; Taught by Ada Cheung. We started the semester by designing a colour chart. The colours that are seen on a laptop or a computer screen can be different to what the plotters printed. The colour chart was an important design tool for making colour correct maps. The course was an introduction on how to visualize maps. The difference between qualitative and quantitative data types, as well the proper design and use of map symbols. Ada’s goal was to make us design a better map. From choosing colours to deciding the layout and types of symbolization and sizes. What were the most important features on a map and how to choose symbols that would show the importance of the data without sacrificing content. Using Corel suite of programs, Ada taught us how to design thematic maps and use layouts that would enhance any map.
Introduction Remote Sensing and Image Interpretation; Taught by Jim Norton. While not trying to make us into remote sensing gurus, Jim gave us a basic the concepts of Earth Observation Systems, satellite images, how they are acquired, as well the interpretation of the images using the electromagnetic spectrum. As GIS technicians, when we look at a satellite image, we need to know how to differentiate what we see. This course was very interesting and provided the basis for remote sensing that I would need for working in any geomatics office.
Communication Fundamentals; Taught mainly by Monica Lloyd, it introduced the students to writing technical papers, presentation techniques and the software to present and communicate what we were learning. Many students coming into COGS have little or no experience researching and the ability to write technical papers. Monica, along with Trish LeBlanc, Joy Brown, and Beth Easson, taught us how to research, write and present technical papers using various software programs. Part of the term was spent researching an environmental issue and writing properly cited and referenced, technical paper and doing a 15-minute presentation based on the topic. In the world of geomatics, it’s a valuable skill to have. For the course, I wrote and presented a paper on the benefits of thorium as a nuclear power source.
In the second semester:
The second semester was an extension of the first. The problems and analysis were more complex and students were taught ways create a solution.
Geographic Information Systems II; Taught by Monica Lloyd. The course continued with Digby Map. New ideas and theory concepts were introduced. Additional layers such as soil texture, determining foreign ownership, land use and forest maturity were added. The goal was to produce new data layers with more emphasis on the thematic interpretation of the GIS data. The basics of VBA scripting were covered, as well creating and managing a geodatabase in ArcMap using ArcCatoalog. This gave us a solid understanding of how the software functioned, as well as how to manipulate the data to produce quality GIS analysis.
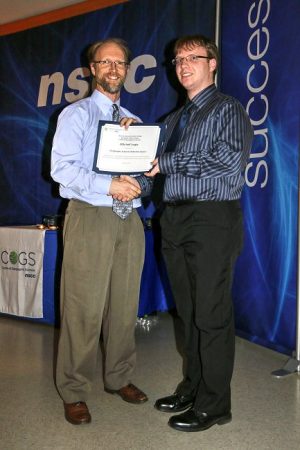
Ed Symons giving an award to Mitchell Logie. (© Photo by- Paul Illsley)
Community and Environmental Planning Studio; Taught by Ed Symons. The course taught us how to evaluate environmental factors used in a GIS. This course was in cooperation with the Thematic Mapping course; Taught my Ada Cheung. The plan was to produce an atlas of the local area based on biophysical concerns: road salt usage, agriculture suitability, and aggregate extraction. The thematic presentation for each plate was just as important as the accuracy of the data. The project taught how GIS data can be used, and analyzed. In the end, we would show how much salt was used in an area per winter, the soil types and agriculture usage, as well as the aggregate areas and zoning within these areas. Thematically, the plates visualized multiple data types and answered a range of questions: What is the road salt usage within a watershed? How much land is being used for agriculture within each land class and how much was zoned for agriculture? The aggregate plate showed areas being used for extraction of gravel and similar products. Based on zoning, environmental, financial and community consultations, potential sites for aggregate extraction were analyzed. The course relied on Ed’s knowledge of geomatics and the environment as well as Ada’s passion for producing thematically sound maps. From the concept of the analysis to its execution, Ed took us from start to finish. He didn’t lead us by the hand but asked and discussed the steps and showed how to pull everything together to get the results we wanted to see. Ed was my first exposure to open source programs like QGIS, Quantum GIS, and GRASS GIS, commonly referred to as GRASS (Geographic Resources Analysis Support System). Other projects for thematic mapping included a Statistical Atlas of Nova Scotia, as well as the theory and usage of the statistical data from the Canadian Government.
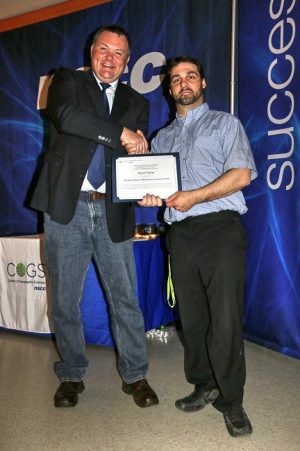
Jim Norton giving award to Ryan Poirier (© Photo by- Paul Illsley)
Introduction to Digital Image Processing; With Jim Norton, we went deeper into the functionality and usage of digital image processing using ERDAS Imagine and PCI Geomatica. This included satellite images, aerial photos, and remotely-sensed data. The goal was to teach a GIS user how to integrate remote sensing data into a GIS by using geometric and radiometric correction, orthorectification and enhancement, and image classification. While not designed to make us professional remote sensing technician, it gave the basic concepts and ideas of how to use digital images in a GIS analysis.
Piers Churchill presenting an award (© Photo by- Paul Illsley)
Computer Aided Drafting for Mapping Applications; Taught by Piers Churchill. The course taught us the basics of AutoCAD and how CAD drawings could be integrated into a GIS, with spatially correct vector data. Starting with simple widgets to a basic site plan and an orthorectified mosaic of satellite images using vector data. These were some of the projects we used to learn the functionality of AutoCAD. From the basic drawing tools used to design a widget, to creating and labeling a basic subdivision site plan. The course showed us how basic GIS data can be created by surveyors, and then incorporated into a GIS as shapefile, with spatially attached attributes. Week by week, we systematically learned the basics of AutoCAD and how important it is in the production of geomatics.
Quotes about the Faculty at COGS
Here are quotes that I found online about some of the faculty at COGS from past students:
Ela Dramowicz: “Probably the smartest person at COGS. She has been there since GIS started. Bravo Ela!”
Mark Hebert: “Not a bad teacher, jokes so bad you laugh because they’re so poor.”
“Very detailed procedures, assignments were identical to examples used in class.”
Monica Lloyd: “One of the most passionate teachers at COGS, and will make your work better. Put the work in and she will respect you.”
Ed Symons: “Best teacher at COGS. His class is too chill. He wings every class and still manages to get his lesson point across. Did you get lost within the lesson? Don’t be afraid because this guy will be willing to spend 4 hours with you after class to make sure you pass!”
Ada Cheung: “She knows her stuff, but don’t slack off or she’ll drown you with projects and assignments”. I also found a video that Ada participated in 2012, which I found appropriate: Ada Cheung: Cartographer
Jim Norton: “Jim is amazing. He understands that most students do not want to take Remote Sensing, and so he tries his best to make it easy on us all, while still ensuring that those who are interested remain so.”
In Conclusion
The GIS program at COGS exposed me to the different geomatics fields and gave me an understanding how each career could be used by the other. From basic concepts to advanced analysis, the COGS program showed how the decisions of everyday people, companies or governments were based on data and how that data was interpreted. When a road or bridge needs to be built, it’s up to the geomatics professionals to look how the land around road could be affected. This could include environmental buffers, soil quality, or extreme slopes, to name a few. The factors could be basic or detailed, but at the same time be very important. Geomatics is used to analyze many ideas and problems, such as habitats for wildlife, flood planning, network analysis for first responders, or research to find the best placement for a business or new seniors complex within a community. The possibilities are endless and only limited by the idea and the data available to the geomatics specialist.
Every year David Maclean and the Advanced Geomatics students publish a Graduate Profiles booklet: 2015-2016 Graduate Profiles. This is a great resource for employers looking to hire talented COGS graduates, it also contains a brief history of COGS. In April, the school holds a year-end awards ceremony to commemorate and honour the achievements of the graduating students. It’s a time to reflect and look back on some the highlights of being part of a COGS education. The photos are by Paul Illsley and can be found at: 2016 Awards Banquet.


“most students do not want to take Remote Sensing” What?! What?! It’s the coolest part!
Not my opinion was a student comment in 2015.
I arttended the COGS 2017 Industry Expo. All
morning I was trying to track down Ed Symons. Finally
at 1:30 he made his way to the cafeteria for the free
chilli lunch,needless to say I wasn’t the only looking
for him. All morning Ed was with a student to catch
him up. It just proves that the quote from 2011 is still
true today. We both had a laugh when I showed him the
Quote.