
PredictION is an app that provides transit authorities with a unique approach to engage and inform the public. By making use of General Transit Feed Specifications, PredictION will allow users to predict the impacts of possible changes in the transit system and assess differences in service between current and proposed services.
The PredictION app was developed in response to the Esri Canada Centres of Excellence 2015 App Challenge, which asked contest contestants to make creative use of Esri technology to solve local issues.
Our team consisted of Jonathan Van Dusen, Majuratan Sadagopan and Shanqi Zhang. Jonathan is an undergraduate geomatics student interested in volunteered geographic information (VGI) and the usability of online mapping applications. Majuratan is a Masters of Geography student interested in automated contextualization and association of VGI data. Shanqi is a PhD student of Geography specializing in VGI and public participation GIS. All three of us are members of the Spatial Decision Support Lab at the University of Waterloo, and our focus on using spatial technologies to enhance decision-making carried over to the app challenge.
As representatives of the University of Waterloo, our team decided to tackle a pertinent issue within the Region of Waterloo. Transit has been a major topic of discussion among the student and local community due to the development of Grand River Transit’s ION Rapid Transit system, recently approved for construction. Despite the popularity of the ION project, our team found that there was relatively little information available about how the project would actually impact the way people move around the city. We thought an app that could allow users to predict and compare commute times of the new service in contrast to the old service would provide a great deal of value to the community as well as the regional transit authority. From an application perspective, our goal was to replicate the type of service and functionality provided by Google Maps and its transit services.
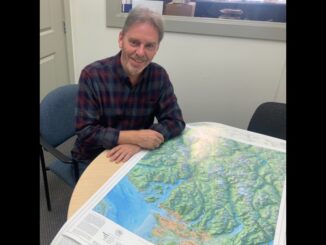
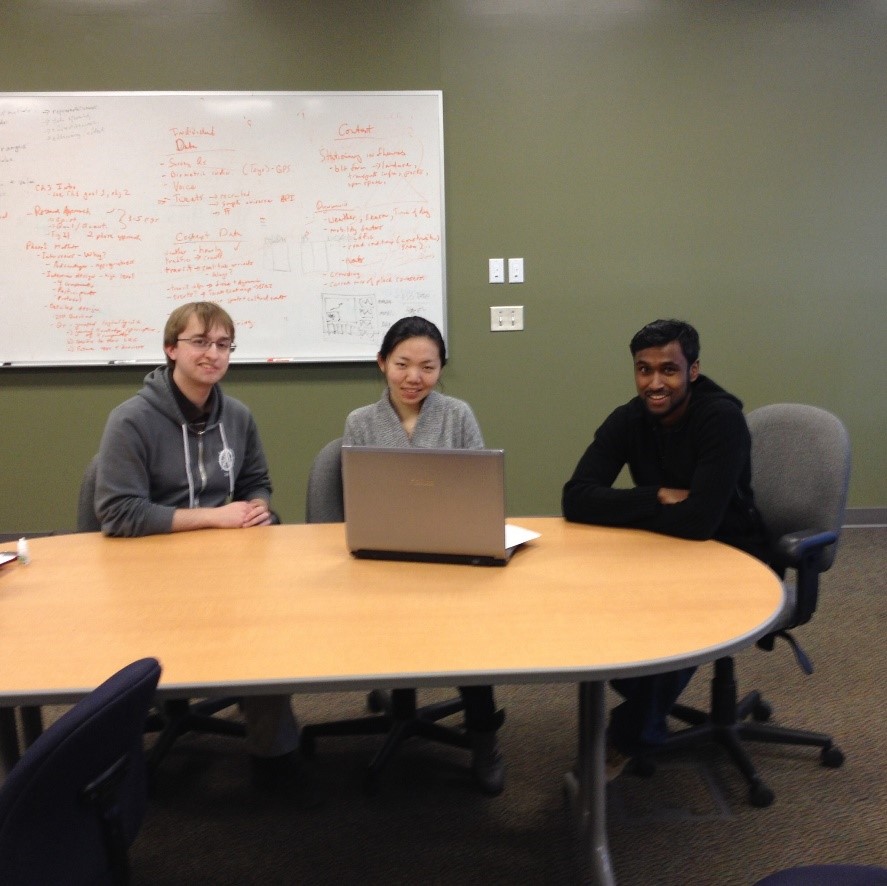 UW Team SDS (l-r: Jonathan Van Dusen, Shanqi Zhang, Majuratan Sadagopan
The initial vision for the project was to incorporate vehicle and transit routing. In order to make this functionality possible, we had to acquire address, road network, transit, and place-of-interest data sets. Fortunately, most of these datasets were available on the Region’s open data portal, but transit data was particularly challenging to deal with due to shortcomings in data and the format of the data itself.
Transit data was provided in a standard developed by Google known as GTFS, or General Transit Feed Specification, which is not well supported by Esri’s line of products. When developing this app, a technique had to be developed to create new GTFS data and to incorporate GTFS data into the ArcGIS Network Analyst extension, which was used to generate routes for the application.
To support this app’s analysis, we created a hypothetical schedule for the first phase development of ION LRT (Kitchener-Waterloo) and aBRT (Cambridge), based on information from Grand River Transit (GRT) of the Region of Waterloo. In particular, we used the total traveling time, peak hour and off-peak hour service frequency, and operating time according to GRT’s proposal. We then used python programming to generate a GTFS-formatted bus schedule data set. Travel time, service frequency and operating time window are used as input to generate multiple bus trips during the weekdays and weekends, which we further deployed to create network datasets in ArcGIS environment.
The python tool we developed for generating GTFS data can be applied to other public-transit studies. It can be used to generate GTFS schedules for hypothetical purposes like our study, as well as generate data for existing bus routes with known schedules.
We included two types of network analysis in PredictION: routing and service areas. In the routing analysis, users can select one of the two transit networks (i.e., the existing network or the proposed network), start and end locations, and a time of day on a regular weekday, and view these routes on the map along with information on the route’s distance and travel time as calculated from the GTFS schedule. Users are able to compare routes from the two networks, as these are displayed on the map using different colours.
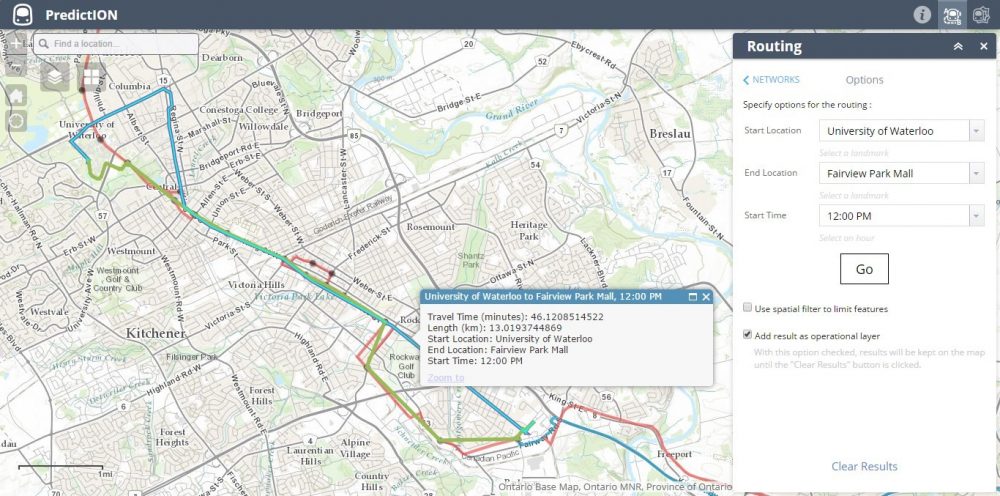 Routes between the University of Waterloo and the Fairview Park Mall in Kitchener using the existing Grand River Transit network (blue, selected) and the same network with the ION Rapid Transit line added (green), at 12 pm on a normal weekday
We used a similar approach for the service-area analysis: users can select a transit network, a start location, and a time of day, and view the areas that can be reached within 10-, 20-, and 30-minute intervals. As with routes, service areas for the two networks are displayed in different colours, allowing users to compare how far they can travel using each network.
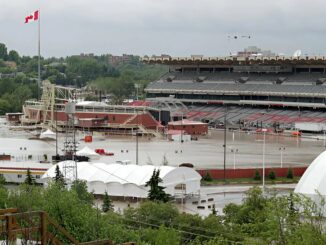
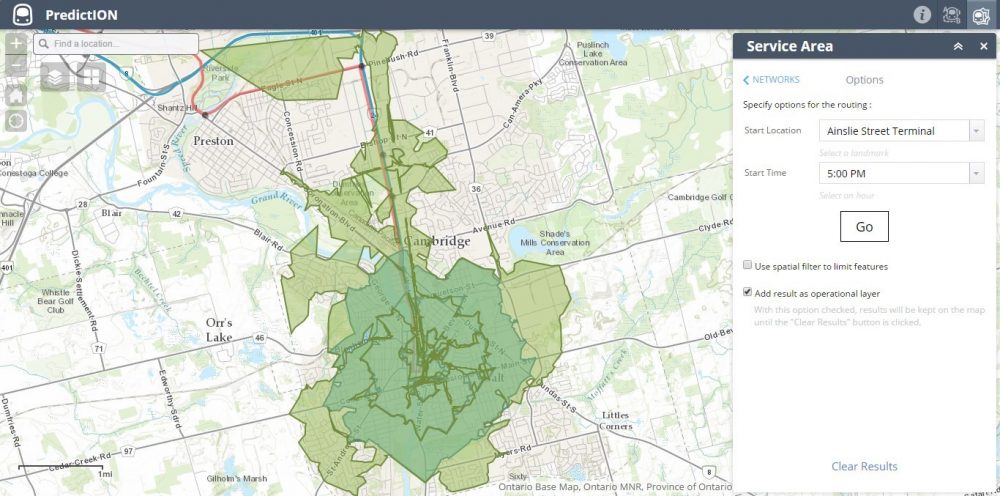 10-, 20-, and 30-minute service areas from the Ainslie Street Terminal in Cambridge, at 5 pm on a normal weekday, with the existing network’s service areas in teal and the new network’s service areas in green
We calculated the routes and service areas using the Network Analyst extension in Esri’s ArcGIS for Desktop suite. Indispensable to this effort was a prototype add-in for adding GTFS data to ArcGIS, developed by Melinda Morang and Patrick Stevens at Esri, which allowed us to include transit stops and schedules in our network analysis. The web app itself was created using Esri’s Web AppBuilder for JavaScript.
Our original concept for the app would have allowed the users to choose any start and end locations by clicking on the map, and to choose any time of day for the analysis, and then our app would generate the routes and service areas using ArcGIS for Server in the background. However, due to technical difficulties with our servers and some time constraints, we made a last-minute decision to simplify the process. Instead, our app gives users pre-defined choices of start and end locations and times of day on a regular weekday. For the start and end locations, we selected major points of interest across the Kitchener-Waterloo-Cambridge area, including universities and colleges, shopping malls, and major transit terminals. We also selected fifteen times of day at half-hour intervals spanning from 8:00 AM to 10:00 PM. We automatically created all the routes and service areas ahead of time using each combination of locations and times of day, and the app displays these on the map depending on which options the user selected. In total, we created 6,750 routes and 1,350 service areas, using the ArcGIS ModelBuilder and Python tools respectively.
We certainly enjoyed participating in the Esri Canada Centres of Excellence App Challenge! It was an honour to have won the competition, and we are very pleased with the positive reception our app has received. The challenge was an incredible learning experience and we are excited to head to San Diego this summer for the Esri International User Conference.
Be the first to comment