
QGIS: Performing Viewshed Analysis on Archaeological Sites
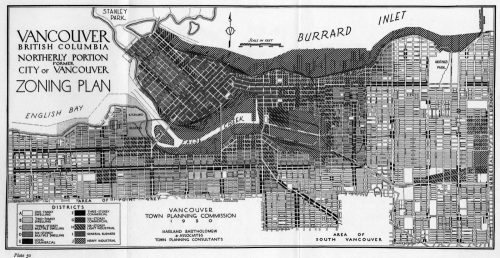
In 1927 a Vancouver bylaw was enacted that limited the height of buildings to a maximum of six stories in height over much of the West End of the city, as illustrated in the Zoning Plan map, from 1930.
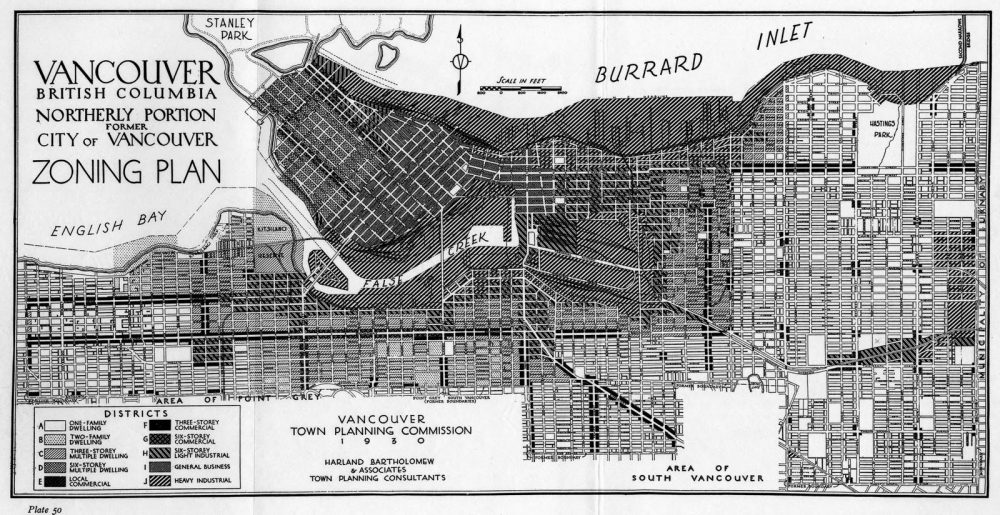
Vancouver Zoning Plan, 1930, shows a limit of six stories for the West End
One of the reasons for this bylaw was to continue to provide downtowners an unobstructed view of the water and mountains for which Vancouver is so famous.
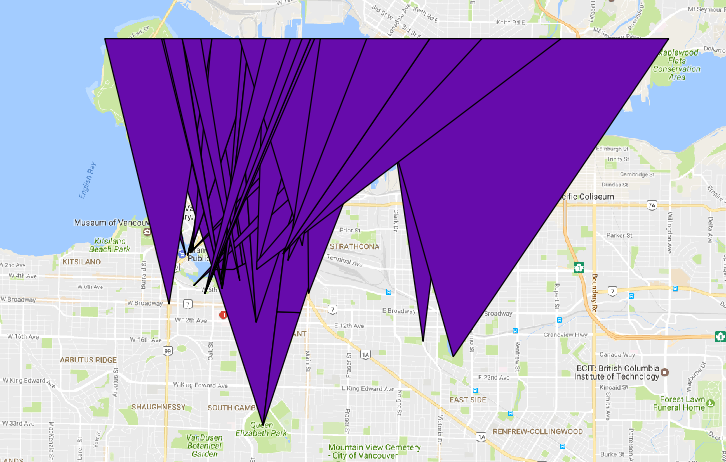
Vancouver view cones
The six story limit has long been surpassed, but the City has managed to hang onto 27 protected views, which are called “view corridors” to preserve the remaining views of the North Shore Mountains, the Downtown skyline, and the surrounding water.
The study of views like this is called viewshed analysis in GIS . A viewshed is an area that is visible from a given location, and takes into account obstructions such as mountains, forests, and manmade structures.
There are many uses for viewsheds. One application might be for security purposes during a major parade; spotters in buildings along the route should be able to see the whole route. Given a starting number of spotting locations, viewshed analysis could check for areas that the spotters could not see. It would be necessary to fill in these non-visible areas with other spotters.
Another application commonly seen in Canada is the protection of views when major changes to the landscape are planned such as the placement of wind turbines or power transmission corridors ( (n.d.) Dragan, M., Fernetti, M. & Rescia. GIS-Based Solutions for Conventional and Renewable Energy Sources Trieste, Italy and Milan, Italy from Golder & Associates).
Istria Peninsula
Recently, archaeologist Zoran Cuckovic created a viewshed analysis plugin for QGIS for a study that analyzed Bronze Age settlements in the Istria Peninsula along the Adriatic Sea. Cuckovic donated his plugin to the QGIS repository and created a tutorial on the plugin.
The tutorial and the study provide a fascinating window into the world of archaeology and the insights that can be gained using viewshed analysis. The study seeks to answer the question, “Did Bronze Age dwellers in Istria locate their hilltop sites based on how many other hilltop sites they could see?”
Viewshed Analysis plugin
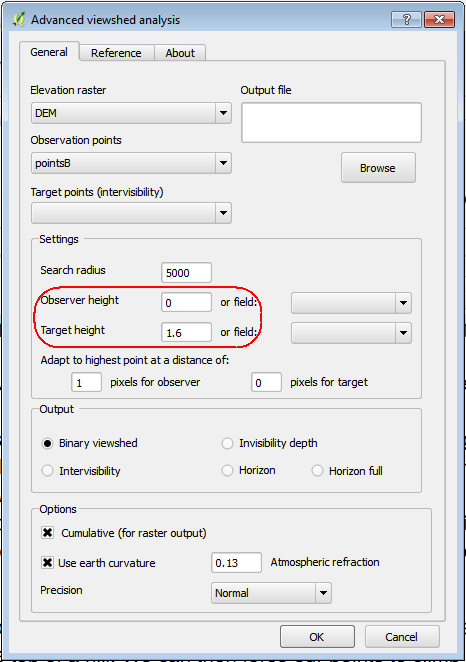
To configure the Viewshed Analysis plugin, you need only an elevation raster for the area of interest and a collection of points that represent Bronze Age settlements. Dividing the points into two camps of arbitrary location will provide us the locus for our study: how many settlements in Camp B can be seen by settlements in Camp A?
The Viewshed Analysis plugin uses the concepts of observer and target to define the two camps. An Observer height of 0 m and a Target height of 1.6 m will tell us how many sites in Camp A, standing at an average eye level of 5’ 2” can see the ground in the sites in Camp B.
Given 4” of height from eye level to top of head, Cuckovic estimated the height of these Bronze Age dwellers at approximately 5’ 6”. That is small compared to today, but it is generous by one inch compared to other studies of such settlements (https://www.quora.com/What-was-life-like-in-Neolithic-and-Early-Bronze-Age-Britain).
Cuckovic also included a setting for “Adapt to highest point at a distance of”. This setting accommodates the fact that the pixel on which the hilltop site resides might not be the actual high point of the settlement. We may assume that if a Bronze Age dweller wanted to see another site, he would move to the highest point nearby the settlement.
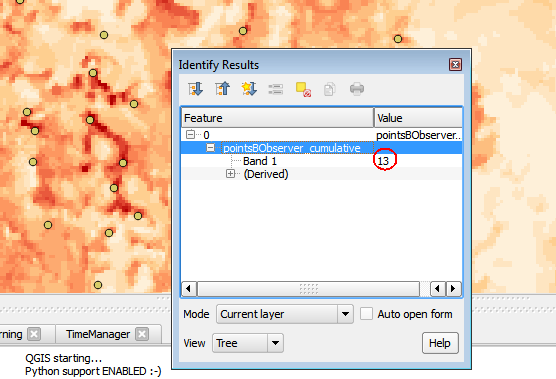
Raster cells show how many Camp A sites can see each cell
Executing the tool and analyzing the result raster, we see that some Camp B sites can be seen by as many as 13 Camp A sites.
That seems like a lot, but to what do we compare the results?
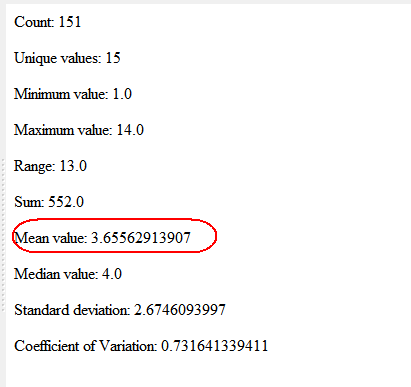
On average each Camp A site can see 3.65 Camp B sites
The next step is to put the Camp A sites on the map, and use the Point Sampling tool to obtain the number of sites that each Camp A site can see. Generating statistics for these numbers, we find out that on average, each Camp A site can see 3.65 Camp B sites.
But is this figure statistically significant?
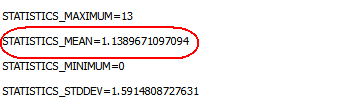
The average for all cells is 1.138
The last part is easy. The result raster from the previous step will tell us that its average value is 1.13.
Now if the Camp A sites can see 3.65 Camp B sites and other locations in the raster can see only 1.13 Camp B sites, that means that Camp A sites can see 3.65/1.13 = 3.2 times more sites than these other locations.
Thus you could make a good case that Bronze Age dwellers in Istria chose their settlements at least in part based on the visibility that they had to other settlements. What conclusions we can draw from these results is the realm of archaeology; for us, we have answered our question using visibility analysis.
But understanding Bronze Age settlements with GIS technology is only one takeaway here: there is another one that is even more important. It is that Open Source programs like QGIS and other GIS software are now of high enough quality that scientists in skilled disciplines like archaeology can use them for their research.
And in the end, as with Zoran Cuckovic, they may give back their work to the Open Source community so that we can all benefit.


These analyses are quite helpful for me, and I am glad that you have shared the review here with us. I am in love with archaeological sites, and so this blog post is useful for me.