
After experiencing another Toronto social event thanks to GoGeomatics Canada, I am reminded of how a night out can increase the chance of injury. Perhaps that’s an odd connection to make in the eyes of some people, but the research out there through the use of GIS and an understanding of spatial analysis, has effectively illustrated the hotspots of violent injury in Canadian Cities.
May 22nd, 2013 featured a presentation by Blake Byron Walker in the Department of Geography at Ryerson University. Walker is an alumnus of the Geographic Analysis program at Ryerson University, who is now a graduate student at Simon Fraser University. His Master’s thesis, “Spatial-Temporal Epidemiology of Violent Trauma in Urban Environments”, investigated clusters of violent injury in the Metro Vancouver area. As an audience member I also noticed a citation that makes a connection to related research conducted in Toronto. The Injury Prevention Research Office at St. Michael’s Hospital and the Department of Geography at Ryerson University had collaborated on an earlier study investigating the “Patterns of Urban Violent Injury: A Spatio-Temporal Analysis” published in the open-access journal PloS ONE in 2010.
Being the leading cause of death of Canadians aged 1 to 44, Walker and his team, used geographic methods to identify drivers of injury, for this important but ignored public health problem. Under the supervision of Nadine Schuurman of Simon Fraser University, Walker used GIS to identify strong clusters of violent injury. Trauma registry data was used and clusters were present in two major locations.
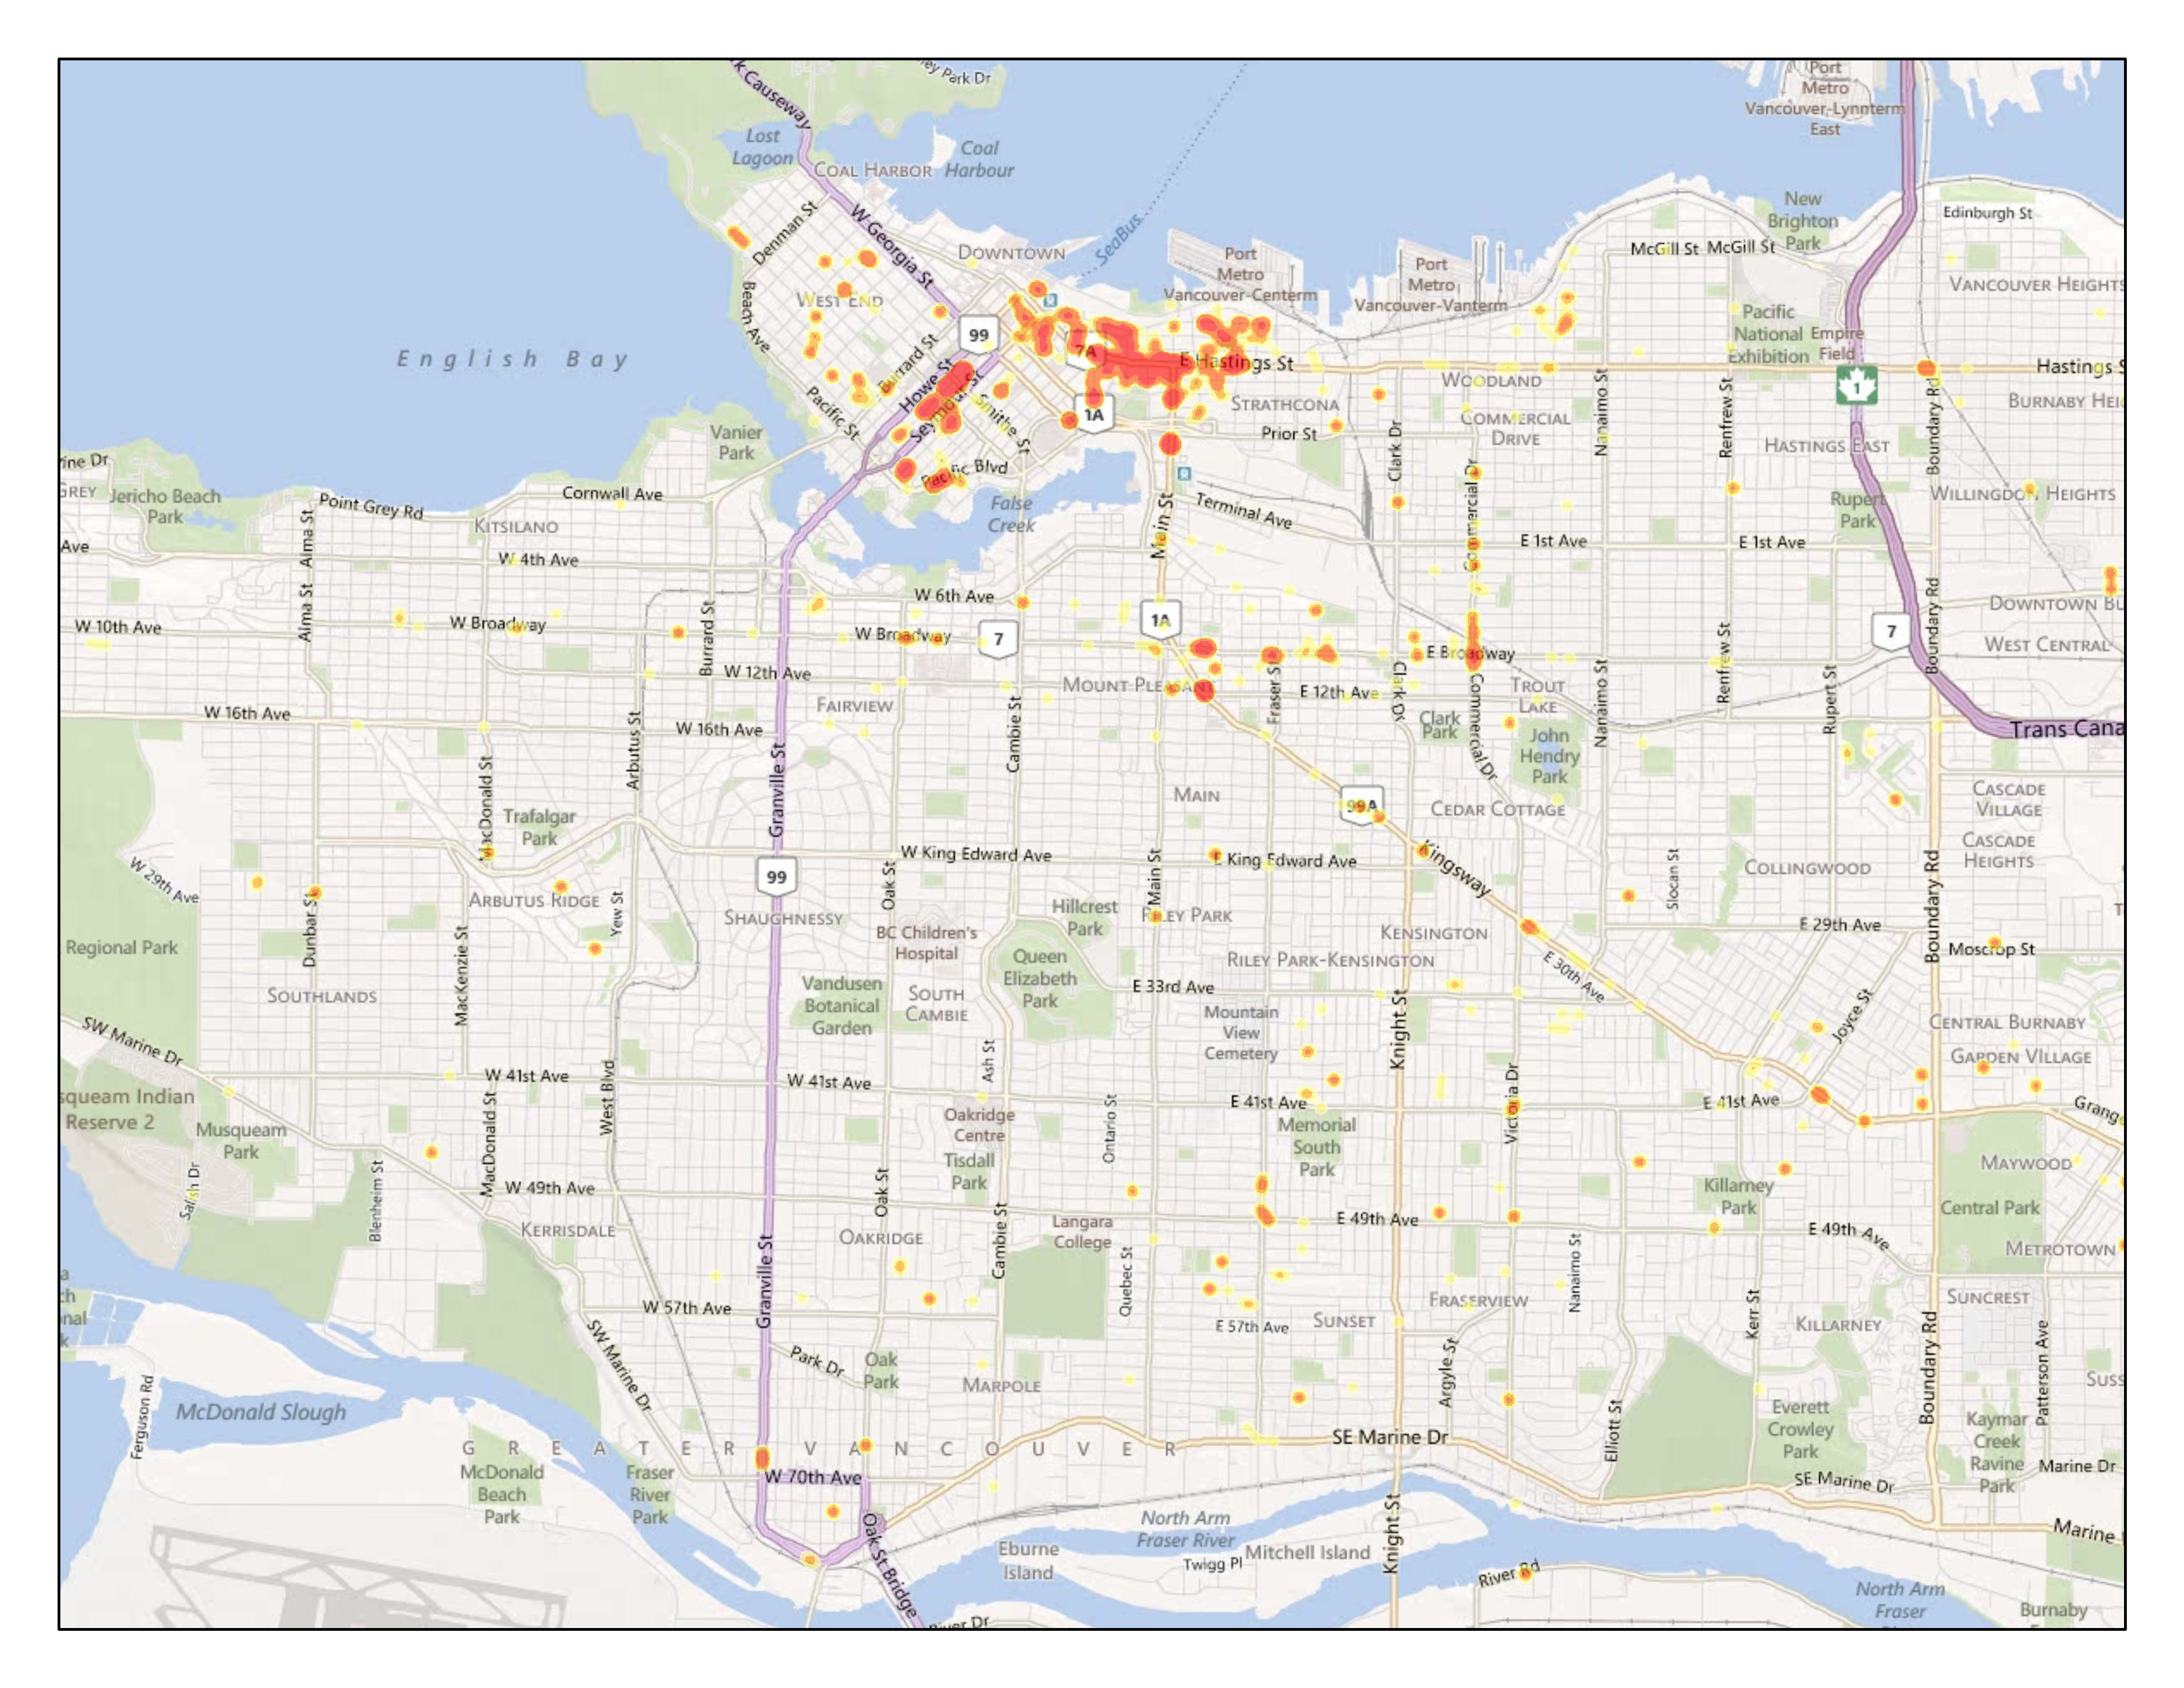
(Used with permission from Blake Byron Walker, with rights to the image)
The first was Vancouver’s Downtown Eastside. This location was an effective illustration of social deprivation. The instance of low-income residential gathering, alongside low-income targeted alcohol establishments appeared to have a close association with the occurrence of violent injury. When the research was conducted on the streets, there was evidence of the controversial “Broken Windows Theory” playing a factor, although the authors are not jumping to any conclusions. This theory states that urban environments that are not well maintained can be victimized from urban disorder and vandalism, additional crime and anti-social behaviour. The consumption of alcohol openly in the streets was also a common sight. Higher rates of alcohol consumption have been linked to socioeconomic deprivation. Another interesting finding was the clustering of violent injury on Friday and Saturday nights around 2AM, centred in the downtown area of Vancouver known as the nightclub district. Again this area of the city is familiar with alcohol consumption and the establishments or clubs that sell it.
Walker’s research had several key aspects that rounded off the investigation of where violent injury was present. The tools and methods at his disposal to conduct his research were GIS in identifying hotspots, environmental scanning, the examination of areas of interest at 24 hour and 7 day scales and the converging facts of victim age, sex, and weapons, mapped and consulted by literature. The locations of interest for the research were determined by the use of the Jenks algorithm, which looks at the elevations of values and points out natural break in the collection of data.
Interesting findings that stood out were the levels of violent injury were consistent in areas with high amounts of graffiti but, strangely enough, the graffiti discovered appeared to have no gang affiliation, this being a common connection usually made with violent injury in neighbourhoods known as being social deprived. High-density residential housing, close proximity with commercial areas, transit nodes, adult businesses, public restrooms, and homeless shelters at various, but significant degrees were found near the hotspots and the literature supports this association with the controversial broken window theory. With this said however, the occurrence of violent injury for Vancouver’s nightclub district is not due to social deprivation but essentially is concentrated in the drinking, supply, selling and so on of alcohol. This pattern of injury as mentioned earlier is apparent during time intervals after the clubs and bars have closed and during the weekend.
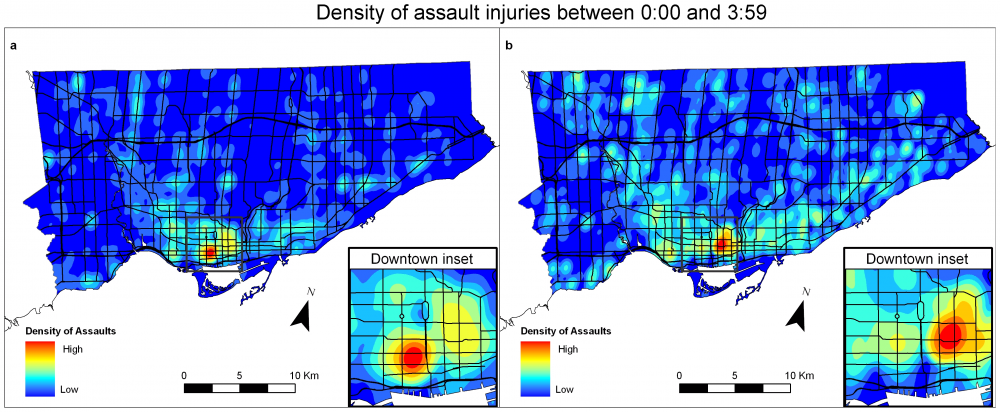
Cusimano M, Marshall S, Rinner C, Jiang D, Chipman M (2010) Patterns of Urban Violent Injury: A Spatio-Temporal Analysis. PLoS ONE 5(1): e8669. doi:10.1371/journal.pone.0008669
The Toronto connection and its earlier research used an ambulance dataset and emergency room admissions to explore the spatial characteristics of injury. The research of my hometown mirrored Walker’s research in a number of ways. It promoted the notion that areas with social deprivation were prone to violent injury, seeing as one of Toronto’s hotspots was Regent Park, a neighbourhood that was so deprived it was forced into redevelopment that is on-going to the present day. Also the instance of alcohol consumption and injury was reflected in Toronto’s entertainment district, known for its bars, clubs, commercial activity and its close proximity to transit nodes.
In this instance we find ourselves in the application of GIS and how valuing the knowledge of spatial analysts can truly impact worldly affairs or just community based concerns at the municipal level. This examination of spatial epidemiology which looks at geographic patterns of disease through setting, social factors and other deciding factors of health events takes me back to John Snow in 1854 and the discovery of waterborne cholera transmission in central London from a water pump. I think that as both professionals and enthusiasts of geomatics, we should freely discuss and concern ourselves with the advancement of the technology, but to see the value in making the world a better, safer place by applying GIS to concerns such as injury, takes us to a higher level. Blake Byron Walker who also referenced John Snow, and I think we should promote research that uses GIS to promote well-being in our urban environments, we should locate the problems in the words of Blake Byron Walker “…in search of our figurative water pump”.
For more information on Blake Byron Walker please visit http://www.sfu.ca/~bwalker/
Be the first to comment