
With all the buzz about investing in, expanding, and modernizing infrastructure, one key aspect seems to be almost universally overlooked: the unknowns about what lies beneath the ground. This is especially true for underground assets. We all see amazing demonstrations of 3D visualization applications, virtual and augmented reality, depicting assets above and below ground. Amid the excitement at seeing these, a key question needs to be asked: where did the data come from?
Mass data capture, at least of above ground features, has undergone a revolution. Satellite imagery, airborne lidar and imaging, mobile mapping, advanced processing, classification, and automated feature recognition; these are all fueling a near realization of digital cities, digital twins and continuous representations of reality. The efficiencies that these can bring to infrastructure design, construction, and operations could be the key to the success of so many infrastructure investment initiatives. But underground, that is a different story. Without a better picture of what lies in this “final frontier”, the status quo of damage, change orders, work stoppage, and rework is the reality. And the dream of “the new infrastructure” could be much harder to achieve.
Preliminary Investigation
Skilled practioners using an expanding array of high-tech tools can detect, identify, and map underground utilities in near-high-precision 3D. But it can be an expensive and time-consuming proposition, especially if you are tying to build a digital twin of a large tract, or a whole city. Before a subsurface utility engineering (SUE) specialist or locate team, is sent out to map a site, wouldn’t it be great to have a bit more confidence in the records used to plan that field work? Especially if, as in many cases, there are scant or no records—this can lead to the need to scan the entire area for evidence.
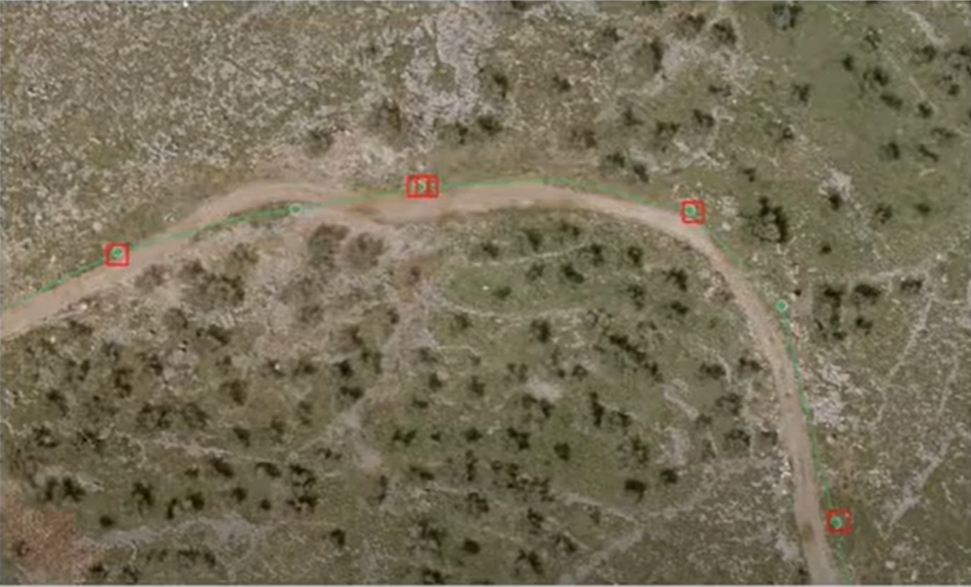
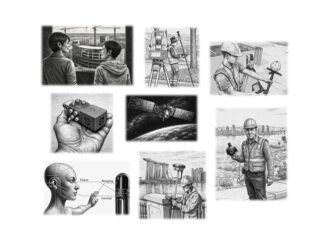
It is a standard SUE and location service practice to consult records; those from utilities, from capital improvement plans (as-designed, and as-built if those were required), and right-of-way records of local and regional entities. Another step that can be taken is to examine, when available, high resolution aerial images. Trained eyes can look for telltale signs of underground features, like changes in the surface, utility appurtenances (maintenance holes, valves, etc.), and vegetation differentials. This is before any of the costly and time-consuming field investigation is done. Before the ground penetrating radar (GPR) units are brought out, the locator devices, the signal and gyro-tracers, and before any potholing is done. With a more complete view of the likely location of utilities, SUE field investigations and locates can be focused, greatly reducing wasted time and effort. Now, this preliminary discovery and analysis process is being automated.
Telltale Signs
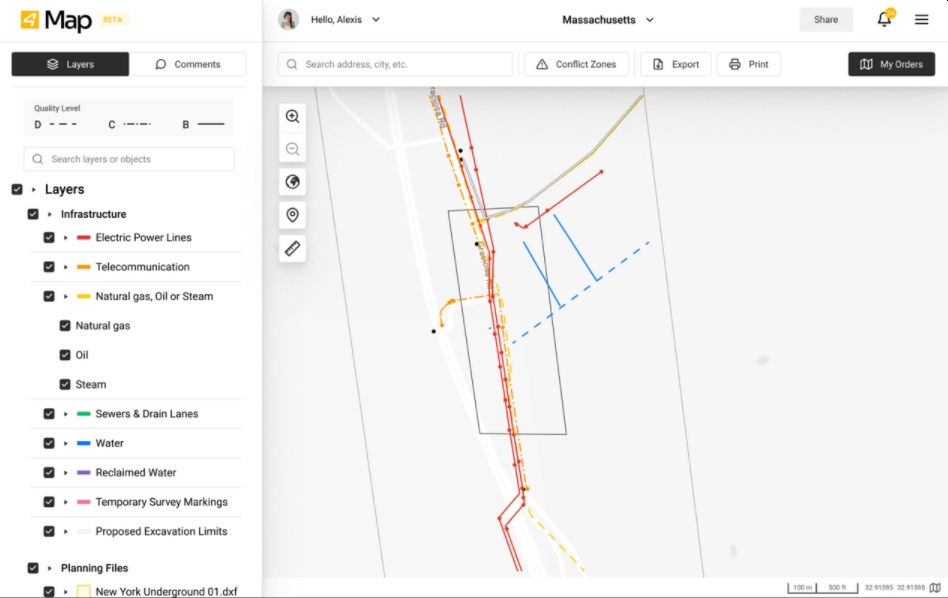
4M Analytics is an Israel-based company that is just now stepping out of the startup phase and has matured their services and applications to the point where a customer base is growing, as is the company. Their flagship service automates underground mapping by using AI to analyze images and records (they call this “4Map”), and they have companion field applications for real-time asset management and command control (“4Dig”).
“A customer only needs to send us the area of interest and any available data they may have about the underground assets,” says Raz Ezra, director of business development for 4M Analytics. “We acquire aerial and satellite images for that area at a very high resolution and assess it together with any additional utility records we’re able to find.”


Then they run their AI technology to look for signs of any on-surface objects and phenomena that indicates on the presence of any existing underground utilities in the designated area of interest “This takes from a few days to maybe a few weeks at most,” says Ezra. “But we are getting more efficient all the time and planning to reach our goal of 250 square kilometers per day later in 2021.” Furthermore, Ezra says: “The real idea is to create the first global geo-database of subsurface utilities, and that will generate additional applications”.
Where is does the tech come from? 4M’s team combines former officers from the Combat Engineering Corps, with deep understanding of underground detection, and from the Geospatial Intelligence Agency of the Israeli Defense Force. They leverage technology and analysis techniques that were been used, until this point, for defense purposes and have brought this to the civil engineering domain.
The key to this progression is that with AI, the system is learning as it goes. Whether they are looking at telltale signs of utilities, pipes and structures, or hazardous materials, the knowledge base grows. The ultimate goal, as 4M states as a core vision is to someday see this process done for every part of the earth. And updated frequently enough to serve as the underground asset fabric of a global digital twin.
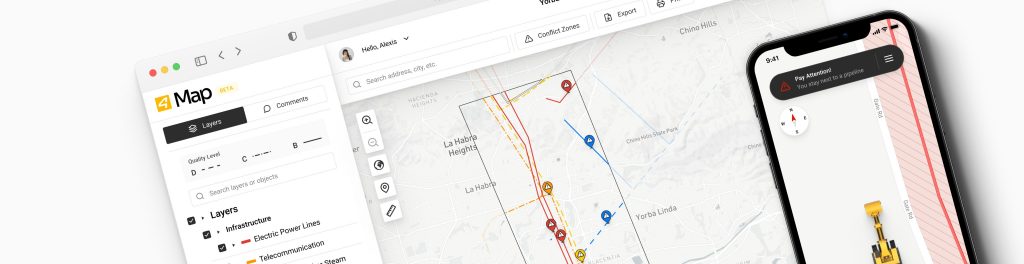
4M’s other key application is for the end users of their geo-databases and maps. “4Dig is a real time excavation tracking app, a mobile app for damage prevention,” says Ezra. “It aims to reduce utility strikes. That means that we get an area of interest for project, let’s say before the construction phase. We map out the area of interest with our mapping engine. And after we mapped out the area of interest of all existing pipelines, we implement this base map into the mobile app.” A construction contractor can provide this app to their excavator operators and managers to avoid hitting utilities. It is monitored by GPS, and when they get close to an underground pipe, an alarm goes off. This kind of geofencing can be found in many highly-integrated machine control systems, but 4M offers this as a standalone app that could be used by any size operation.
How accurate can this mapping be? That would depend on the resolution of the satellite or aerial images, and their availability. For instance, there are some counties that have full satellite imagery coverages of 1m or less, as open-source data. And some cites or regions with public aerial images of decimeter or less resolution. Then there are plentiful commercial image sets as high-resolution options. These variables could affect costs, data completeness, and accuracy, but in most parts of the world (where there would be a likelihood of underground assets), 4M is able to access good image sources.
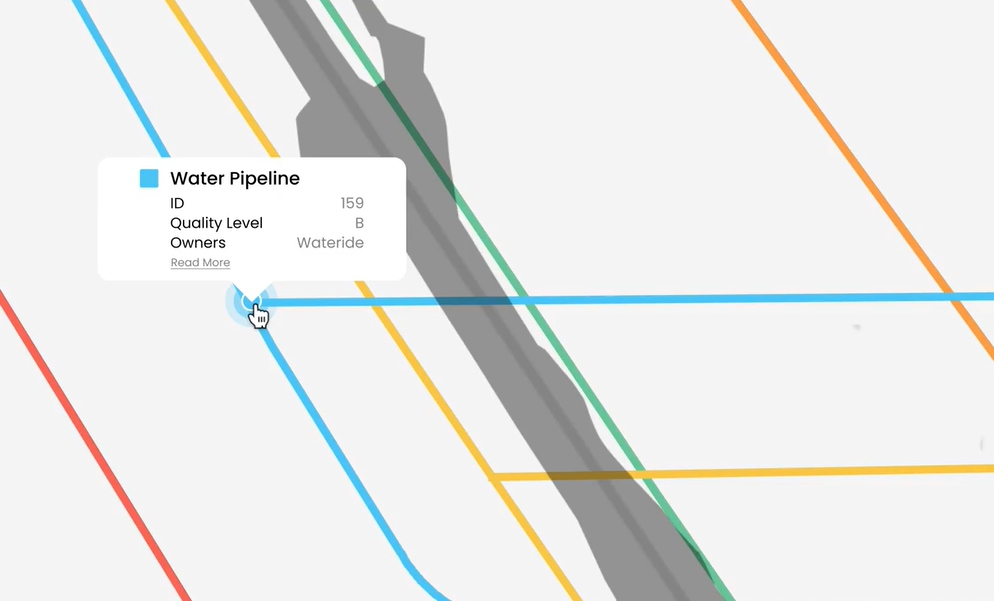
While this approach does not provide a depth for utilities, horizontal accuracy can be quite high, depending on the resolution of the source images and other factors. What 4M emphasizes is that accuracy (horizonal position) is defined by a precise tolerance, based on the data and indications 4M’s machine extracts, which is verified by imagery analyst experts during the QA process. Of course, if there are no high-resolution images available, or the client seeks better accuracy, a side contract to a drone crew could provide that.
The role that records plays in the process is more about identifying what type of utility might be there. Many utility records, if they are not based on an as-built survey, are mostly schematic in nature. “We rely on records for only about 10-20% of the analysis and we don’t take them for granted, but only as a reference,” says Ezra. “The rest relies on our mapping and analysis capabilities. This helps us to have an open mind to seek for any unrecorded/abandoned facilities”. This makes sense, as their focus is on rural area analysis at this time. But as their “bots” gain more knowledge, they expect to be able to analyze urban areas in the very near future.
Ground Truth
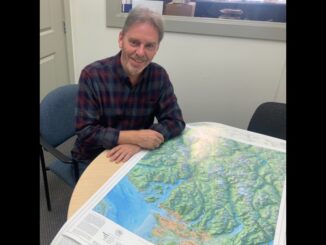
A healthy does of skepticism might be in order were it not for the fact that AI-base feature recognition is evolving so rapidly for AEC and geospatial applications. Some folks have jumped right in to evaluate and adopt this tech. An early customer in North America is Colorado based Goodbee and Associates, a women-owned utility engineering, landscape architecture, and environmental planning firm.
David Smallwood, SUE project manager with Goodbee says that colleagues had first learned about 4M via LinkedIn and were keen to try it out. They started with a small site, so it would be cost effective to do complete traditional locates to contrast with the 4M data. “Next, we tried a larger site, one that had previously been a mining site, so we were not sure of the extent of what was out there,” says Smallwood. “We liked what we got back; it had the utility lines marked in the Shapefile by type.” Impressed with these results, Smallwood says that Goodbee will definitely tap this resource for future projects, to help focus their field locating operations.
Another Layer
Ezra is very clear to note that 4M does not view their technology as being a replacement for SUE mapping; but more a supporting tool to aid in analyses. This is just another way to view evidence. It is simply automating what some folks already do by looking at records and aerial images, but in some cases picking up what the human eye might not, especially when trying to examine large areas. It helps reduce speculative field location activities at a very high scale.
In talking to their client, David Smallwood, he brought up a very good point; that this type of map alone, should not be assumed to meet any of the standard utility mapping quality levels. Like those from the American Society of Civil Engineers. CI/ASCE 38.02 is the widely adopted “Standard Guideline for the Collection and Depiction of Existing Subsurface Utility Data”, and is often required at the contract level, especially for work in transportation rights-of-way (that carry many utilities). Several U.S. states like Colorado and Montana, have also made as-built surveys for utilities mandatory.
The stakes are high, to avoid utility conflicts, rework, etc. And to help avoid further occurrences of utility related tragedies. The ASCE standards assign levels of quality, from” A” that is surveyed and verified exposed utilities, to “D” that is information derived from existing records or oral recollections. How would 4M’s maps be classified in the context of these standard quality levels? As this is so new, no assumption should be made, but the conversations in the SUE and standards communities have begun. This is not to say that this additional mapping data could not streamline the path to a specified quality level, as it most certainly can.
Will this tech take-off? Considering it is just beginning to be noticed and should progress in its automation levels before more widespread use, the prospects look good.


Be the first to comment