
On July 7, 2017 a series of devastating wildfires began in the Cariboo region of British Columbia. The effects of these wildfires will take much time and many resources to make recovery. GIS can have an important role in such a project. GIS can:
- Help managers to make real time decisions in rapidly changing conditions
- Provide spatial information to the public
- Feed data to fire-fighters in the field through mobile devices
- Identify damage and help plan for recovery
One useful tool that GIS provides is a swipe map. This map shows one area in two maps side by side. One side represents the “before” scene of an event such as a fire, the other side represents the “after” scene of such an event.
Making a swipe map with Open Source software involves an impressive stack of technologies. This article shows how to make a swipe map this way.

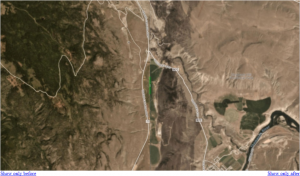
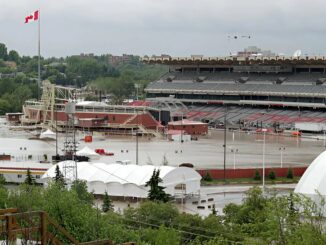
First, we start with the before and after images of the given scene. CBC published an article which contained side-by-side images of the devastation in the Cariboo. These images were captured by Planet Labs. I have copied the images of Boston Flats.
These are excellent images, but they are not on maps. To put them on a map, we have to perform a number of steps.
To put two images side by side with a slider, we use the jQuery Before/After plugin. This plugin uses the great jQuery and jQueryUI libraries. Like a lot of plugins in the Open Source world, it was created at no charge by someone with developer skills who just wanted to make something useful.
You can see the Boston Flat images used with this plugin by clicking on the image to the right.
Such is the excellence of the code that the details of jQuery and jQueryUI are all hidden and the web developer merely has to tell the beforeAfter plugin where to make the images:
$(function()
{
$(‘#container’).beforeAfter();
});
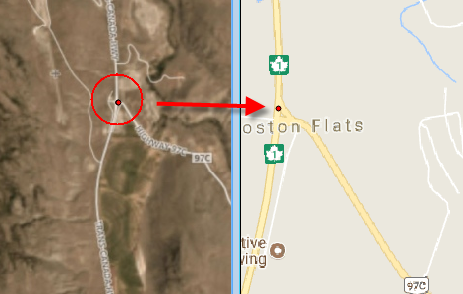
Now we have the slider, but these images are not on a map. To do that, we open QGIS and invoke the Georeferencer tool. This tool provides an interface where we can match a discrete point on a map with the same point on an image. In this case the matching is easy because we can match to well defined features on the image such as the intersection between Highway 1 and Highway 97C.
Now we have georeferenced images, but for the next step we must tile them. Tiling means cutting up an image into pieces so that the pieces can be assembled at different resolutions. Tiling speeds up the browser’s rendering of an image.

There are numerous tiling programs, but QTile is particularly easy to use because it is a plugin that we can easily invoke by opening QGIS. The plugin gives an impressive list of options:
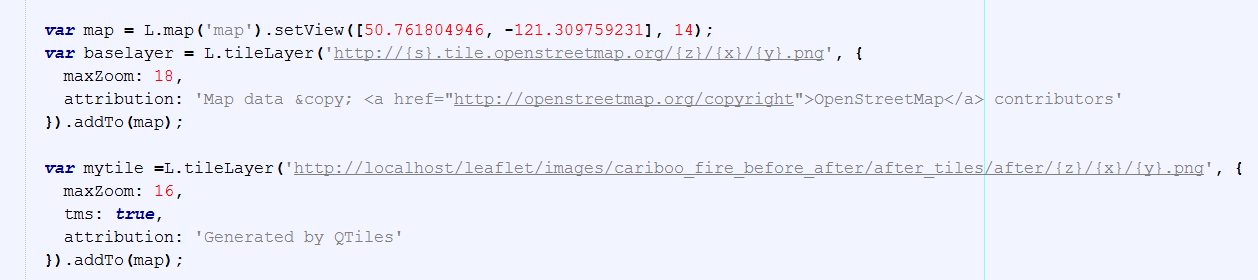
The great feature of this plugin is that after it creates the tiles it gives you an HTML page that shows you the JavaScript that you need to load the tiles in the HTML page.
The final component of our web map is Leaflet.Sync. This module allows us to see a synchronized view of two maps. Leaflet.Sync is based on the jQuery Before/After plugin described above, which in turn is based on jQuery.ui and jQuery. The mapping part is based on the Leaflet API. Got it all? Somehow every piece falls into place and the end code is quite simple.

You can see the Boston Flats Swipe Map by clicking on the image to the right. The map shows the images georeferenced to Boston Flats and is synchronized with the slider.
Viewing damage caused by forest fires is only one application for swipe maps. Changes in agriculture, population, and forestry are all suitable candidates for this type of map. Viewing the same map from two perspectives can help us to understand our world and to plan for the future of our planet.

Be the first to comment