

What is the Canadian Statistical Geospatial Explorer?
Statistics Canada produces statistics that help Canadians better understand their country. The agency ensures Canadians have the key information on Canada’s economy, society and environment that can help function effectively as citizens and decision makers. It supports open data initiatives by the Government by making various datasets publicly available and regularly updated. So far, the datasets have been available as a tabular view with multiple filters to narrow down your search. Filters include subject, geography, frequency and statistical program supported.
But, the recently launched Canadian Statistical Geospatial Explorer (CSGE) makes it much efficient to filter and visualize data sets alongside. It is a user interactive web mapping tool that empowers users to discover Statistics Canada’s geo‑enabled data down to the smallest level of detail available, the dissemination area. Users can find, explore, then export data in various formats to use in their workflows. Users can also customize the map and change basemaps (satellite imagery, topography, etc.) to view data in a different context. Accessible for free on the Statistics Canada website, the CSGE tool allows users to view, visualize and download census, health and community data at geographies across Canada. The application uses licensed Geocortex Essentials Technology for Esri ArcGIS platform.
Owing to its commitment and responsibility towards governments, businesses and Canadians alike, with the information they need to respond to, and recover from the COVID19 pandemic, Statistics Canada has made available some related datasets. These would be extremely helpful for researchers, health professionals and data analytics enthusiasts. Neighbourhood income and proximity to public transportation are now included with other health indicators that can be valuable for statistical analysis and decision making.
How to access CSGE?
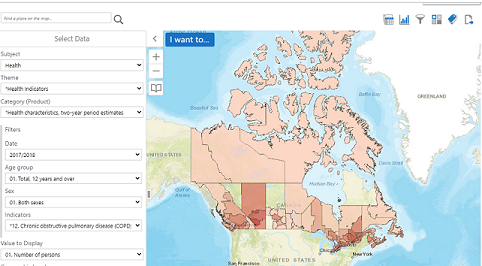
Click here to launch the Geospatial explorer. The explorer opens an embedded ESRI basemap with a data selection panel to its left
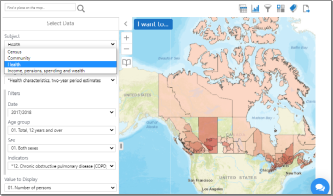
While Selecting Data, you can choose between four subjects
- Census
- Community
- Health
- Income, pensions, spending and wealth
Once you choose your preferred subject, the corresponding theme and categories of datasets reflects in the dropdown.

Once you apply the data selection settings, you can enhance your map by choosing the right basemap, selecting the map extent that works for you, change map styling, toggle labels and view legend information.

You can view datasets in tabular format, as charts and finally export data as a map pdf, charts or report
You can also download data as an excel document instead, to be used with your own data analysis. There are some tutorials available to help understand this tool. You can also find other resources and examples.


Wonderfully explained. Brilliant article
A great article, thank you for the
clear and concise information. Tanya!