
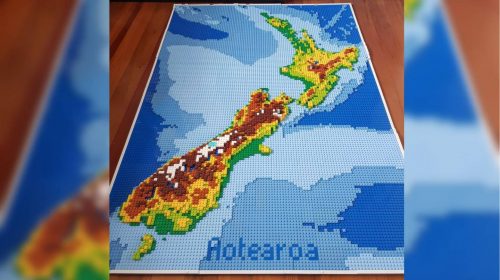
Data analyst’s incredible NZ Lego map made with 3600 bricks
German Alex Waleczek, who lives in New Zealand, made an accurate 3D model of a map of New Zealand. The map is 90cm x 128cm x 3.3cm and weighs 7.8kg. Waleczek used QGIS and data from Land Information New Zealand (Linz) to plan the map.
Waleczek’s lego map was planned down to a “T”:
- Each brick represents 10km, resulting in a scale of 1:125,000
- Colours were chosen to match the standard colour scheme for typical elevation maps, from green to yellow to brown and white
- A formula was used to show the different depths across New Zealand
https://nzherald.co.nz/nz/news/article.cfm?c_id=1&objectid=12324601
COVID-19 lost loved ones and recovery stories project
Years ago, Esri created an application called “Celebrating Lost Loved Ones” which pays tribute to people lost to the opioid epidemic. Now that we are currently undergoing a pandemic, a similar platform was built to memorialize those lost to COVID-19 and also share stories of recovery.
People around the world are invited to submit a memorial story or share their own story of recovery. Each submission is validated by volunteers before posted to an interactive map.
https://www.giscorps.org/covid19-llo-283/
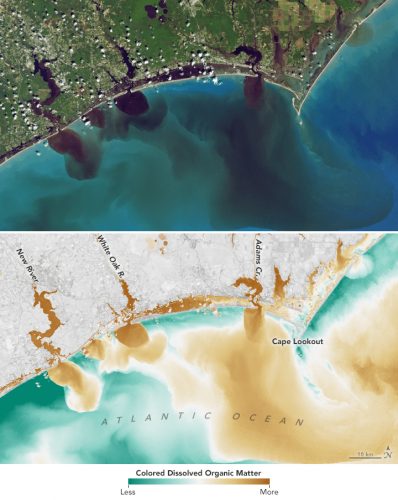
Monitoring Lakes Using Remote Sensing Data
Many different forms of pollution are affecting lakes around the world, threatening much of the freshwater supply. Standard monitoring techniques are hard to employ as many lakes are too large, remote or a region may have so many that the cost and effort is too great.
Satellite-based remote sensing is proving to be a useful tool to effective monitoring. Using the instruments that are already on current satellites, scientists can monitor thermal pollution and total suspended matter (TSM).
The data gathered from satellites is combined with the data gathered from ground-based sensors, resulting in a more rapid identification of the threat levels different water sources face from different forms of pollution.
https://www.gislounge.com/monitoring-lakes-using-remote-sensing-data/
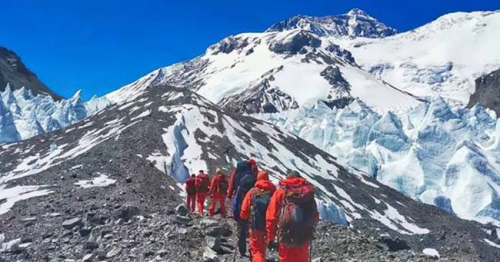
GNSS receivers reach the Everest Peak
After months of planning, a team of Chinese surveyors, from National Geodetic Survey Team, successfully climbed the summit of Mount Everest on April 5, 2020. The goal was to measure the height of Mount Everest using BeiDou-based Chinese GNSS receivers. This was the first time CHC Navigation’s P5 geodetic GNSS receivers were used to measure the mountain and also the first time Chinese surveyors have ever climbed to the summit.
https://geoinformatics.com/gnss-receivers-reach-the-everest-peak/
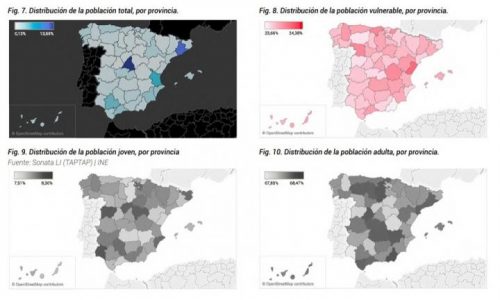
A geospatial analysis identifies the areas most vulnerable to COVID-19
Researchers from Universidad Carlos III de Madrid (UC3M) are using geospatial analysis to identify the areas that need increased protection against new outbreaks of COVID-19. UC3M collaborated with TAPTAP Digital and used data from Predicio and Tamoco to determine the areas of Spain requiring more attention and to increase measures of protection from the spread.
Extracting data using geospatial tools allows for a broader analysis of the developing behaviour of the pandemic based on factors such as: area, population mobility, or spread of COVID-19 in relation to any phased recovery of commercial or industrial activity. The data gathered can help institutions and the community better understand the COVID-19 pandemic. For example, it was noticed that Spain’s population mobility decreased from 25km to 5km per person, per day during the isolation period.
Since the data is provided by global companies, UC3M researchers are working on a scientific article which compares population mobility patterns in different countries. What Spain is doing can be done around the world too.
Be the first to comment