CoreLogic forms strategic partnership with climate risk modelling specialist Munich Re to help prepare Australia and New Zealand for climate change risks.
CoreLogic, a property data company, announced it has teamed up with Munich Re, one of the world’s leading reinsurers, to offer the most comprehensive view of the impact of climate change to individual properties in Australia and New Zealand.
Together, the two companies will be able to provide a view of the risks and impacts of climate related events to home owners, lenders, brokers, insurers and property professionals.
The organisations will be developing consumer research capabilities that will allow real estate professionals, mortgage brokers and front line lenders to help home owners understand the potential exposure of specific properties to natural disasters.
Geospatial data headache solved with Placekey launch
Placekey, a new industry standard for identifying physical places, launched publicly on October 7, 2020.
Placekey solves a major problem for organisations that leverage data assets to drive geospatial innovation. Without access to a common identifier, data analysts had to dedicate a significant amount of time cleaning, normalizing, and organizing datasets in order to join them together. Placekey is a free, common and universally-accepted industry standard for identifying physical places.
Learn more and try it! Visit: https://www.placekey.io/.
https://www.geospatialworld.net/news/geospatial-data-headache-solved-with-placekey-launch/
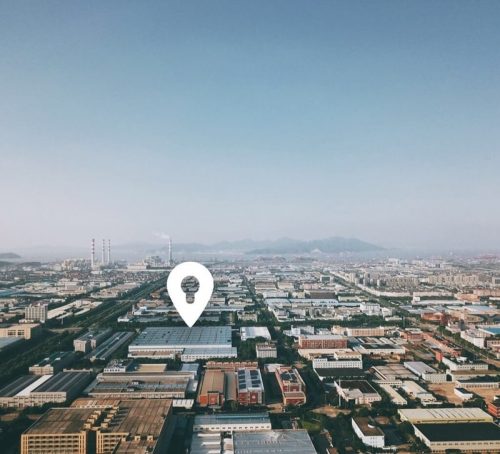
Boiling Point: These maps show how air pollution and COVID-19 can be a deadly mix
The LA Times has a newsletter called, Boiling Point, about climate change, energy and the environment in California and the American West.
One of their latest newsletters shared maps that show a striking correlation between poor air quality and contracting COVID-19. Unfortunately, for Los Angeles, this means that there are higher rates of COVID-19 infections throughout Black and Latino populations.
The historical practices of redlining to exclude Black people and Latinos from “desirable” neighbourhoods has pushed them out to housing close to highways, refineries and power plants, making Blacks and Latinos more likely to regularly breathe polluted air. The maps produced show patterns where areas with more pollution, such as Southeast LA (which has a large Latino population) tend to have worse COVID-19 outbreaks. Greener neighbourhoods, like Bel Air (having a predominately white population), tend to have better air quality and lower rates of COVID-19.
Ultimately, the links between air pollution and COVID-19 illustrate the need for policies that prioritize healthier, more sustainable communities.
Getting Out with Surveying
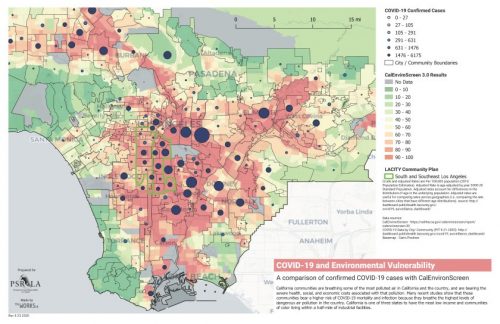
Christopher Golding is a professional surveyor and mapper and has taught surveying to inmates at the Green Rock Correctional Center in Virginia for many years. Due to the nature of incarceration, he often as up to 24 students at different points in learning. To combat this, he had to develop detailed, step-by-step lessons for the software used and Surveyor data collectors. To keep the prisoners engaged, he puts in some competition to make it fun and challenging, for example, seeing how fast one can set up a total station.
The most rewarding part of Golding’s job is when he hears back from a student after they’ve been released – he has received several calls to let him know that they used their new surveying knowledge to get jobs.
https://amerisurv.com/2020/09/27/getting-out-with-surveying/
Global maps of travel time to healthcare facilities
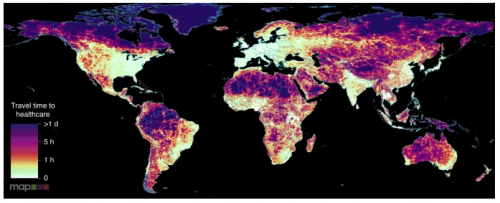
Access to healthcare is a crucial requirement for human well-being that can be constrained by the allocation of healthcare resources relative to the geographically dispersed population.
Using OpenStreetMap and Google Maps, academic researchers have produced maps of travel time with and without access to motorized transport, which essentially describes the travel time to healthcare for populations distributed across a variety of wealth. It was found that just 8.9% of the global population (646 million people) cannot reach healthcare within one hour if they have access to motorized transport, and that 43.3% (3.16 billion people) cannot reach a healthcare facility by foot within one hour.
The study’s maps highlight an additional vulnerability faced by poorer individuals in remote areas. This can help to estimate whether individuals will seek healthcare when it is needed, as well as providing an evidence base for efficiently distributing limited healthcare and transportation resources to underserved populations both now and in the future.
https://www.nature.com/articles/s41591-020-1059-1
IMD to use geospatial data to issue cyclone warnings
India Meteorological Department (IMD) is planning to use meteorological data, geospatial and population data to assess the impact an approaching cyclone will have on a particular area and provide the area with district-specific tailored warnings. They hope that this will help reduce the damage and economic losses to infrastructure and property.
https://www.geospatialworld.net/news/imd-to-employ-impact-based-warning/


Be the first to comment