
“The rate of temperature warming in Canada exceeds the global average.”
Canada’s summer of 2025 not only broke temperature records but also reshaped the landscape of climate extremes in Canada. From the blazing forest fires of British Columbia to the sweltering urban areas of southern Quebec, heat waves gripped the nation in ways that scientists say were far from natural.
Thanks to advanced climate attribution models and geospatial analysis, we can now clearly identify the impact of climate change across the country. These events were not typical weather occurrences; some were up to ten times more likely because of human-induced emissions.
A New Tool for a Hotter World
In April 2024, Canada launched the Rapid Extreme Weather Event Attribution System (REEAP), a component of the National Adaptation Strategy. Unlike traditional methods that can take months, REEAP delivers insights within a week—fast enough to inform public response and policy decisions in real-time.
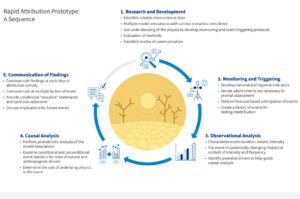
Using advanced simulations, scientists run two climates side by side:
- one with pre-industrial conditions, stripped of modern emissions,
- and one with today’s atmosphere, heavy with greenhouse gases.
The difference between them reveals the human fingerprint. Canada’s 2025 results are sobering: climate change is no longer a distant threat—it’s baked into the weather we live through.
Understanding the results
The results aren’t buried in technical reports; they’re translated into clear language and striking visuals. Imagine two curves on a graph:
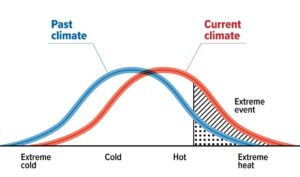
Probability distribution graphs are used to illustrate the attribution of extreme weather. The blue curve on the left represents the probability of temperatures in a past climate, rising to a peak in the center before declining and tapering off at the tail. This is based on greenhouse gas levels before the Industrial Revolution.
The red curve, representing current climate conditions, starts slightly later than the blue curve, peaks in the middle of the graph, and ends further to the right. This means that today, the chance of experiencing hotter temperatures is higher than it was in the 1800s, while the likelihood of extreme cold events has gradually decreased.
The dotted shaded area to the left of the blue curve shows the probability of a heat wave at least as intense as those in the past climate. The lined shaded area to the right of the blue curve illustrates how much more likely such heat waves are in today’s climate.
The red curve’s shift to the right indicates an increased risk of extreme heat. Additionally, the total shaded area under the red curve is larger than that under the blue curve, signifying that heat waves are more probable now than in the past.
Why This Matters
Attribution science isn’t just about pointing fingers—it’s about preparing for what’s ahead. Knowing how climate change influences floods, wildfires, droughts, and heat waves allows governments and communities to:
- act faster in emergencies,
- plan smarter for infrastructure and health systems,
- and raise public awareness of the risks already here.
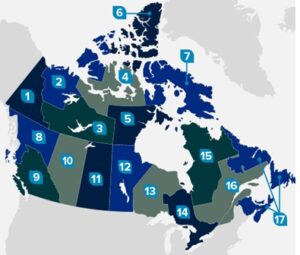
1. Yukon, 2.Inuvik, 3. Northwest Territories, 4. Fort Smith, Northwest Territories, 5. Kitikmeot, 6.Nunavut, 7. Kivalliq, 8. Nunavut, 9. Northern Qikiqtaaluk, 10. Nunavut, 11. Southern Qikiqtaaluk, 12. Nunavut, 13. Northern British Columbia, 14.Southern British Columbia, 15.Alberta, 16.Saskatchewan, 17.Manitoba, Western Ontario, 19. Eastern Ontario, 20.Northern Quebec, 21. Southern Quebec, 22. Atlantic Canada.
In 2025, REEAP analyzed 17 regions across Canada, from Yukon and Nunavut to Atlantic Canada. Each one now has a clearer picture of how climate extremes are shifting, and what it will take to adapt.
The New Normal of Heat
What once felt like unpredictable disasters can now be traced, measured, and mapped. Extreme weather is no longer just weather—it’s a reflection of choices humanity has made, and a warning of what’s still to come.
Canada’s summer of 2025 was not a fluke. It was a preview.


Be the first to comment