
-
Point Pleasant Park Erosion Documented Thanks to Old Map
-
Mapping the Correlation Between a City’s Tree Cover and Urban Inequalities
-
How Spongy is Toronto?
-
Canada Boosts Earth Observation Technologies
-
Mapping Vancouver’s Cheery Blossoms
-
Housing Prices Mapped
Point Pleasant Park Erosion Documented Thanks to Old Map
Using maps from 1858, aerial photos and laser imaging technologies, Jonathan Fowler, an anthropology professor at Saint Mary’s University has been able to document erosion at Point Pleasant Park, Nova Scotia. Some preliminary data suggest up to 10m of erosion. Read More.

Mapping the Correlation Between a City’s Tree Cover and Urban Inequalities
Upon comparing average property assessment value from an ACORN GIS report and tree cover in Sault Ste. Marie, it was discovered that the same outcome was reached with a similar study done by Nature Canada in larger cities. This is prompting some residents in Sault Ste. Marie to create a Citizen Lead Tree Board to address this issue. Read More.

How Spongy is Toronto?
Joing Arup’s Global Sponge Cities Snapshot, Toronto has achieved a rainfall absorption (“sponginess”) rating of 30%. This is done by using Terrain, an Arup tool which utilizes machine learning techniques and satellite imagery to quantify green and blue areas versus grey areas in a city. Read More.

Canada Boosts Earth Observation Technologies
$6.8 Million worth of contracts have been awarded to Canadian companies to further research and development in Earth Observation technologies. This will help Canadians acquire data faster, more precisely and at better quality to aid in decision making processes which can impact national security, environmental monitoring and natural resource management. Read More.

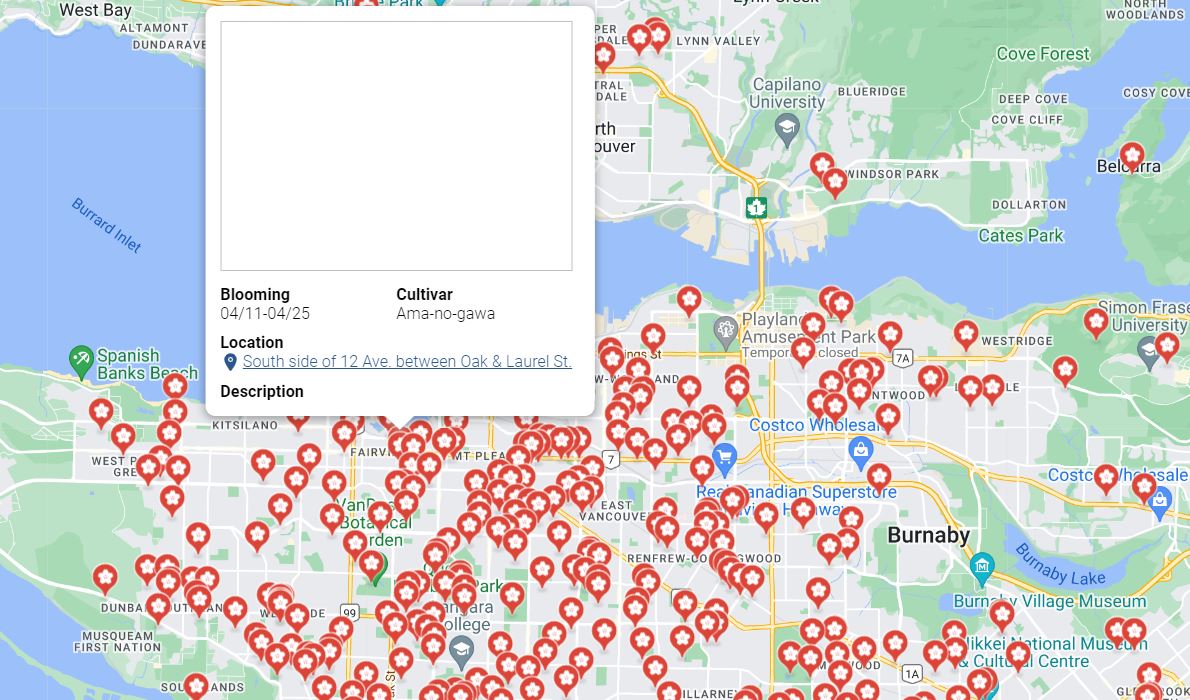
Mapping Vancouver’s Cherry Blossoms
With the onset of spring, Vancouver’s cherry blossoms are blooming. This map put together by Vancouver’s Cherry Blossom Festival shows where and when a tree is flowering.
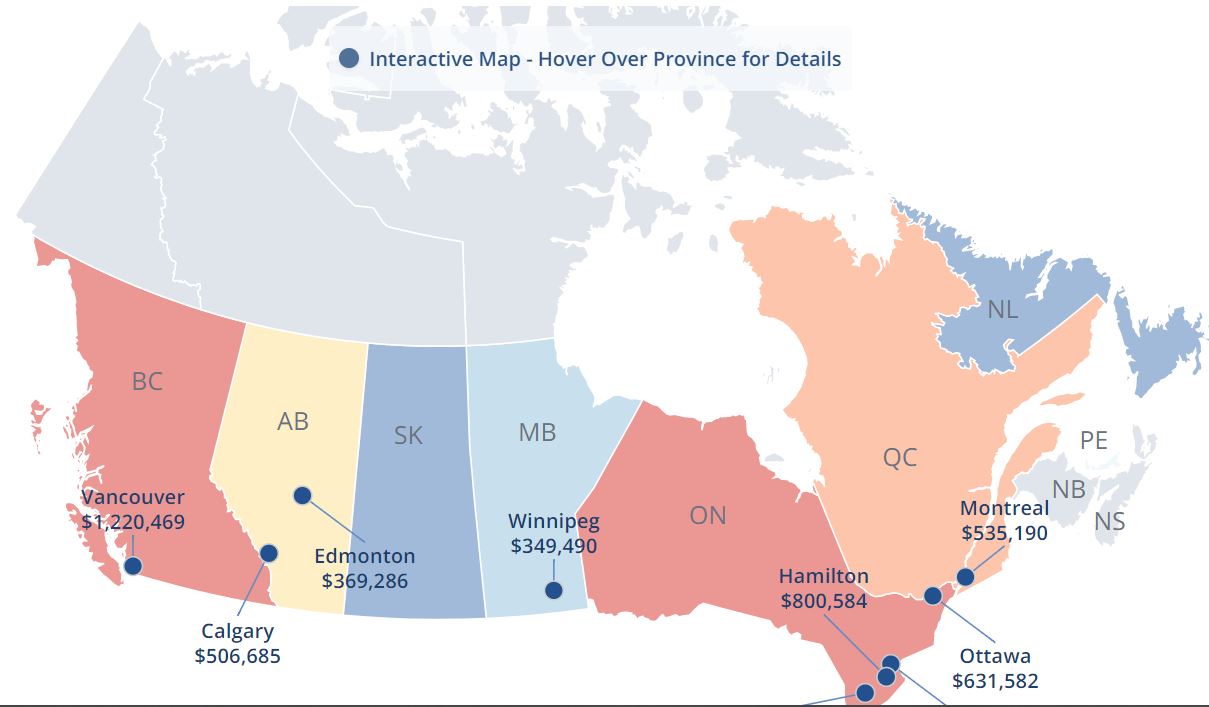
Housing Prices Mapped
This interactive map shows average prices of homes in each province. In addition, changes to property prices are reflected as well. Read More.


Be the first to comment