
1. Permafrost in Peril: The Arctic’s Hidden Climate Crisis
2. Mapping shows Canada’s seabeds could hold billions of tonnes of carbon
3. U of G Receives Over $16M to Lead National Agri-Food Innovation and Training Platform
4. Floodplain Mapping Public Consultation Period Opens
5. Interactive Mapping Platform of Urban Development in Canadian Cities Launched by Researchers
6. Glint Mode Activated: How GHGSAT Satellites Helped Quantify the Nord Stream Leak for the First Time
Permafrost in Peril: The Arctic’s Hidden Climate Crisis
A team of researchers from Woodell Climate Research Center, the University of Oslo, the University of Montana, the Environmental Systems Research Institute (Esri), and the University of Lleida recently released their research on climate-change-induced ecosystem stress in the Arctic.
In this study, the researchers identified areas in the Arctic where permafrost is under threat of melting due to climate change by analyzing three decades worth of geospatial data. Hotspots of climate-stressed ecosystems in the Arctic were identified by examining the change in ecosystem vulnerability indicators over the past 30 years.
While it is known that climate warming puts increased stress on high-latitude ecosystems, these stresses are uneven across the Arctic, and therefore some areas experience more severe stress than others. By visualizing ecosystem stress across the Arctic based on factors such as temperature, moisture, and vegetation it is evident that some places in the Arctic are experiencing more dramatic climatic shifts than others.
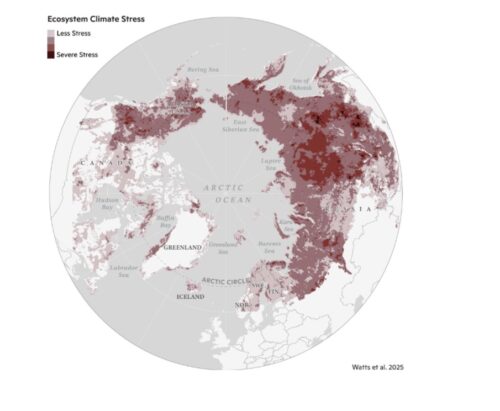
This is one of the several maps created in this study that visualize the severity of ecosystem stress in the Arctic. To view the other maps and gain a better insight into the process the researchers took to conduct this study, click here.
Mapping shows Canada’s seabeds could hold billions of tonnes of carbon
The top 30 cm of muddy seafloors found within Canada’s exclusive economic zone contains almost 11 billion tonnes of carbon, a new study suggests. While the recent focus in the field of carbon capturing has been dominated by the conservation of blue
carbon sinks like mangroves, salt marshes, and sea grass, this study argues that perhaps more attention should be given to the conservation of muddy seafloor areas. The ocean’s biological ‘pump’ absorbs massive amounts of carbon from the atmosphere which is eventually sequestered beneath the ocean floor. 247 seabed locations in Canada which are believed to have high organic carbon contents have been identified and were mapped based on conservation priority.
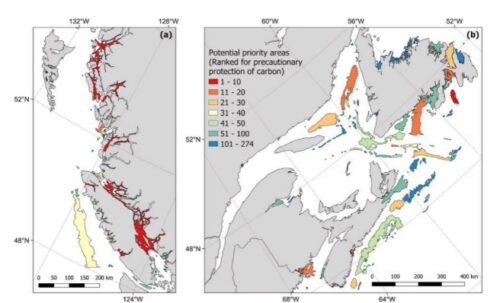
To view the full article and get a better understanding of why regions offshore of Vancouver and Newfoundland are carbon hotspots, click here.
U of G Receives Over $16M to Lead National Agri-Food Innovation and Training Platform
As a recipient of a Lab to Market grant worth nearly $16.3 million over 5 years, the University of Guelph is becoming a national leader in agri-food innovation and training. This grant represents an incredible opportunity for the university to combat the currently insufficient methods of food production caused by increasing global food demand and climate change.

The funds will support its Sustainable Food Systems for Canada (SF4C) initiative, which will be co-chaired by Dr. Evan Fraser, a professor at the College of Social and Applied Human Sciences Department of Geography, Environment, and Geomatics, as well as by Dr. Lenore Newman, a professor and director of the Food and Agriculture Insitute at the University of the Fraser Valley.
This initiative will serve as a training platform and mentorship service program and it will provide events that will aggregate national expertise, allowing for more comprehensive access to knowledge for agri-food-related business growth in Canada. To read more about the plan for SF4C, click here.
Floodplain Mapping Public Consultation Period Opens
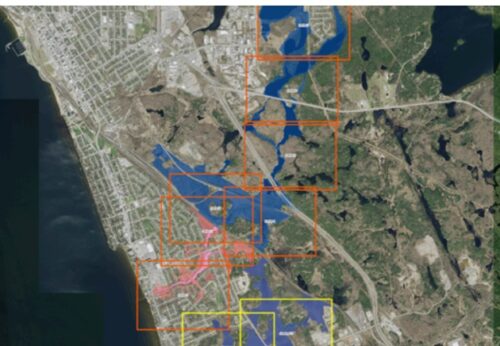
The mapping of floodplains near North Bay, Ontario was recently updated by the North Bay-Mattawa Conservation Authority, a non-profit organization that was founded in 1972. These updated maps, found here, will be used to prevent any new developments from being built in high-risk flood zones. They will also be used to identify existing developments within flood-prone areas to develop more comprehensive flood damage mitigation strategies.
The NBWCA is planning consultation periods to discuss these maps with the residents and property owners around North Bay. To find out more information on the dates and locations of these consultations please follow this link!
Interactive Mapping Platform of Urban Development in Canadian Cities Launched by Researchers
A new interactive mapping platform is allowing users to gain a better understanding of their city’s accessibility needs. Called the ‘Atlas’, this platform enables users to explore an area’s access to transportation, green spaces, and essential services, with each place being evaluated on a rating system that conveys the accessibility of the area.
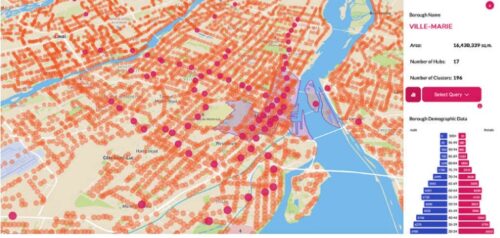
Currently, this platform only has coverage for Montreal, Quebec City, Trois-Rivières, Sherbrooke, and Gatineau. People who live within these cities can use the information to lobby for better accessibility infrastructure in their neighborhood while people traveling to these cities can consult the maps while planning their trip, to ensure that the places they are going to meet their accessibility needs. Click here to read the full article and here to view the interactive maps.
Glint Mode Activated: How GHGSAT Satellites Helped Quantify the Nord Stream Leak for the First Time
A Montreal-based company has recently shed some light on the process they developed to detect offshore methane emissions. Since very little light reflects off the surface of the water in a wavelength that can be detected by sensors out in space, detecting offshore methane emissions has always been very difficult.
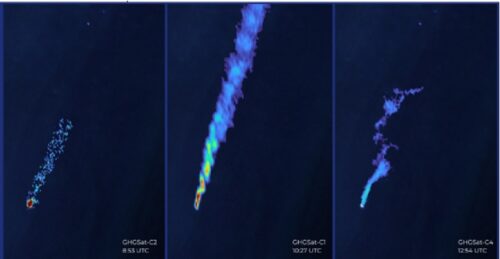
When confronted with the task of detecting methane from the Nord Stream leak in 2020, GHGSAT recognized that the greatest amount of light is reflected off the surface of the water when the sun is closest to the horizon. Therefore, by using the glint of a setting or rising sun, there is enough light available to interact with the methane molecules above the water’s surface before reaching their satellite sensors! Click here to read the entire article to discover just how much methane they were able to detect!

Be the first to comment