GIS data to draw up risk assessment maps for dengue and chikungunya
Dr S Sabesan, an adjunct professor at the Vector Control Research Centre, has been using several parameters with satellite data to make time and risk assessment maps for vector-borne diseases. The three diseases focused on in this article are Filariasis, Japanese Encephalitis, Kyasanur Forest Disease. The article goes into detail for the three diseases and what methods of satellite based mapping tactics were used to document and track the diseases.

The article can be read here
Europe and the U.S. Temperature Maps
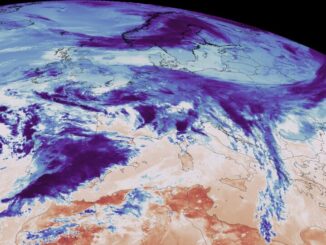
Heading into the peak summer months of 2022 has resulted in record breaking temperatures across Europe and the United States. With areas of the UK hitting 40°C and many parts of the U.S. hitting 100°F (~38°C) and over. Some predictive models have shown that we were supposed to hit these temperatures in 2050. These temperatures are also conducive for forest fire conditions, and are greatly affecting areas of France, Spain, and Portugal.

Satellite mapping has also confirmed ground temperatures to be as high as 50ºC. “Space based observations of the temperature of the surface of the land offer unparalleled knowledge of the spatial structure of these heatwave events,” stated by Darren Ghent, a National Centre for Earth Observation researcher. You can read more here and here
Map shows devastating scale of wildfires across Europe
Related to the previous temperature articles, wildfires are running rampant across Europe. A dry and hot spring has created ideal wildfire conditions in Europe resulting in fire suppression services to take immediate action. Thousands of people were forced to flea their homes due to the fast rate of the fires and other unfavourable conditions, such as wind, making conditions hard to control. As conditions continue to worsen, the EU warns members to prepare for more wildfires over the summer months.

The article can be read here
Siemens partners with GIS software provider to level up grid planning
The partnership between Siemens Smart Infrastructure and Esri focuses on combining their unique expertise to streamline power networks. “[By] combining a major source of data such as GIS with Siemens’ grid modelling and simulation software will significantly elevate the quality of grid models for utilities.” Stated by Jeff Rashid, global director for Infrastructure at Esri.

The article can be read here
Seattle could be engulfed by a TSUNAMI with waves up to 42ft within three minutes if a 7.5-magnitude earthquake hits the fault line off the coast, simulation shows
The potential for a severe Tsunami caused by the Seattle fault slipping could yield severe results. With with 42ft high waves and a 7.5 magnitude earthquake, the resulting wake would flood downtown Seattle take water as far as three miles south of Port Tacoma. Despite the unlikelihood of this specific event occurring, communities in the surrounding area should be informed of the potential. The article has an animated graphic displaying the time lapse of water movement from start to finish similar to the graphic below.

‘Our highest responsibility as an administration is to keep our residents safe, and studies like this are a critical tool in that effort to analyze the data, understand risks and forecasts, and best prepare for future emergencies,’ stated by Bruce Harrell, the mayor of Seattle. The article can be read here


Be the first to comment