-
Prague: a fitting setting for a mobile mapping innovation
- New Tool Helps Solve Geospatial Imaging Challenges
-
An Extremely Detailed Guide to an Extremely Detailed Map of New York City Neighborhoods
- A Series of Interesting Interactive Maps (Israel’s Operation in Gaza, Solar/Lunar Eclipse Map, Tornados in Texas since 1950, and flood map risk of Los Angeles)
Prague: a fitting setting for a mobile mapping innovation
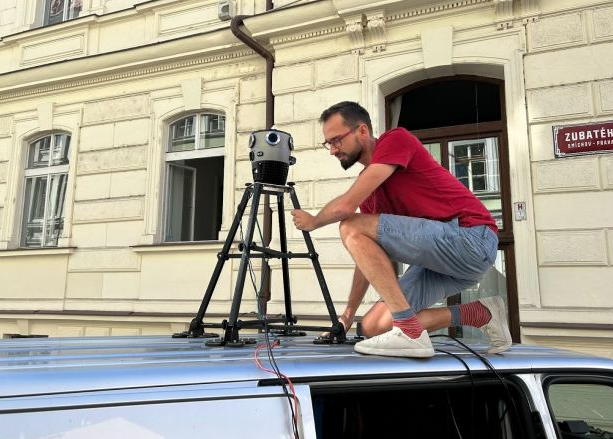
Mosaic and SmartDelta collaborated on a mobile mapping project in the city of Prague. The integration between Mosaic’s 360 degree camera system and SmartDelta’s mobile mapping software was considered a success. The setup consisted of a Mosaic camera system, Applanix GNSS/INS, Xenics thermal camera, Ouster Lidar, and a Hesai Lidar all being successful fed into the SmartDelta real-time software. Postprocessed data allowed for a 3D map of the test area. The results of the test opens up as range of different possibilities/applications such as infrastructure inspection and firefighting.
Check out the full article here.
New Tool Helps Solve Geospatial Imaging Challenges
ERDAS IMAGINE LiveLink for Google Earth Engine is a new non-programing approach to creating geospatial models. It connects the most widely used remote sensing software package to the largest bank of data and processing. See video below for a far more detailed explanation.
Check out the full article here.
An Extremely Detailed Guide to an Extremely Detailed Map of New York City Neighborhoods
The idea behind this map originated from a Yemen air traffic controller living in the Bronx. He looked around at his neighbourhood and realized there was a lot of others from Yemen and many businesses, so with some help from others he got Google Maps to add “Little Yemen” to the area. This interactive map was created based on this idea, what to people living in the different areas of New York city think their area is called. Using various data sources/surveys this map was created. Areas that are multiple colours or are blurred represent areas were people do not agree on the name.

Check out the full article here.
A Series of Interesting Interactive Maps
Interactive Map: Israel’s Operation in Gaza

As the title suggests, this interactive map details Israel’s operation in Gaza. The interactive map can be found here.
Interactive Map: Eclipse Path Tool
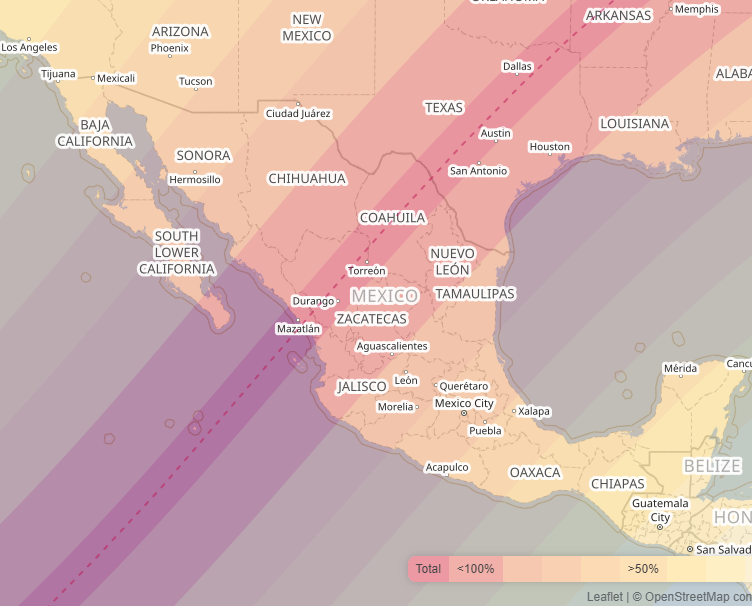
This interactive map allows the user to see where will solar/lunar eclipse be visible. The interactive map can be found here.
Interactive Map: Locations of Texas Tornados since 1950

This interactive map illustrates all the tornados recorded in the state of Texas since 1950. The interactive map can be found here.
Interactive Map: Flood Risk in Los Angeles

This interactive map illustrates areas in Los Angeles that are susceptible to flooding. As well as quantifying howe much water would accumulate in each area. The interactive map can be found here.



Be the first to comment