There is an interesting use case showing how spatial thinking is closely associated with nature and its conservation. Waldo Tobler’s First Law of Geography states that “everything is related to everything else, but near things are more related than distant things.” This law emphasizes the concept of spatial autocorrelation, suggesting that objects or phenomena close to each other are more likely to be similar or have a stronger spatial relationship compared to those farther apart.
This principle has had a significant impact on various fields, including urban planning, environmental studies, and transportation analysis. It brings perspective, triggers analytical thinking, connects us, and allows us to tell a story.
Because of the expanding global population, we already use an enormous amount of freshwater and will likely use it even more in the future. A report from the U.N.’s 2023 Water Conference found that 26% of the world’s population lacks access to clean drinking water. Therefore, maintaining and restoring our freshwater reservoir is of the utmost importance.
What is a watershed?

A watershed is a region of land where all surface water that is in motion flows into a lake or an ocean or gathers at a single location, such as a river mouth.
It is a network of intertwined streams where small streams inadvertently merge with larger streams. Because they follow the path of the natural topography of that region, streams are classified on the basis of their elevation.
In Ontario, we have a fascinating narrative about the Credit River Watershed that is observed and surveyed under the Integrated Watershed Monitoring Programme (IWMP) by Credit Valley Conservation (CVC).
Credit River Watershed: A brief idea
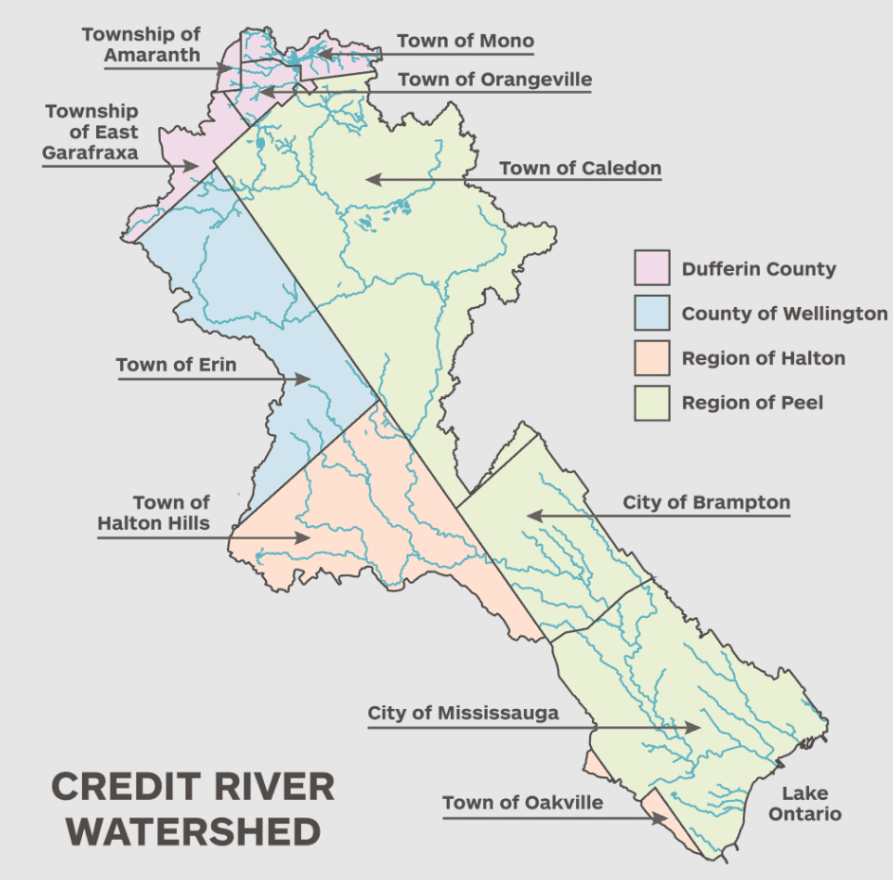
Located in southern Ontario, the Credit River rises above the Niagara Escarpment at Orangeville and Caledon East before flowing to Port Credit, Mississauga, where it empties into Lake Ontario. Approximately 1,000 square kilometers (390 sq mi) are drained by it. The river’s combined length, with its tributary branches, is more than 1,500 kilometers (930 mi).
A snapshot of a Credit River watershed map above portrays regions, counties, towns, and cities that fall along the way of the watershed. In general, the land cover of the Credit River Watershed is composed of 31% of urban areas, 35% of natural areas, and 34% of agricultural and open space areas.
CVC’s Integrated Watershed Monitoring Program (IWMP)
To gain a deeper understanding of the ecology and its patterns in the Credit River Watershed, CVC started the IWMP. Operating for nearly 24 years, it is one of Canada’s most established Integrated watershed monitoring programs. Since its inception, the program has been regularly reporting on the health of ecosystems in the Credit River Watershed. This forms the foundation for water and land management decisions.
IWMP’s Goals:
- Create and execute a monitoring program that is sustainable and robust.
- Manage data to guarantee its accuracy, use, security, durability, and availability.
- Regularly analyze data to assess the health of the groundwater, stream, forest, and wetland ecosystems.
- Results are frequently communicated to inform management decisions and initiatives.
IWMP’s Monitoring
Regularly assessing and recognizing developing patterns in and around the watershed is the only path toward conservation.
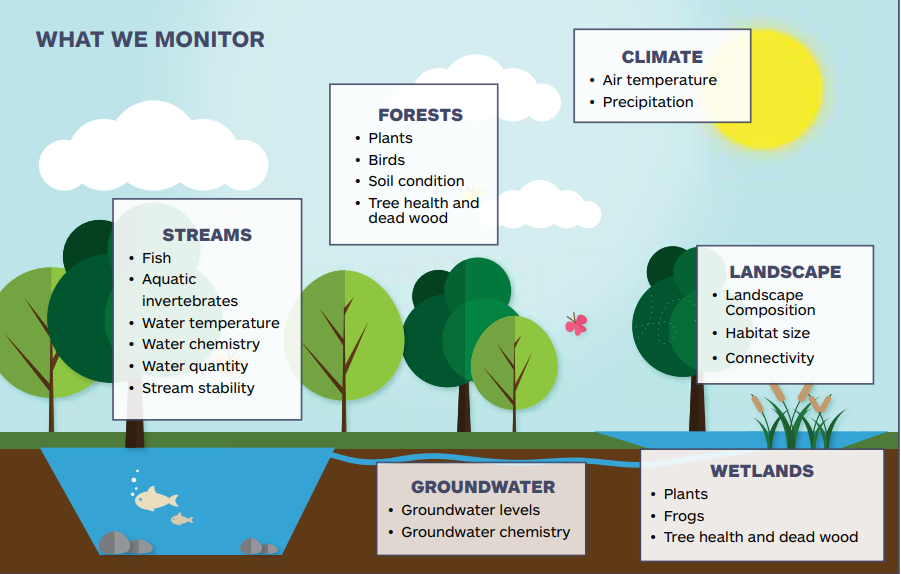
What they monitor
The pictorial chart provided by CVC below gives an answer to this question. Classified in multiple categories and subcategory monitoring becomes systematic and precise.
How they monitor
At fixed locations throughout the watershed, IWMP keeps an eye on the ecosystem’s health. A number of sites are checked yearly, while others are checked every two years. Some indicators are continuously measured using automated technology and others are done manually, using well-maintained tools with strict standards and procedures.
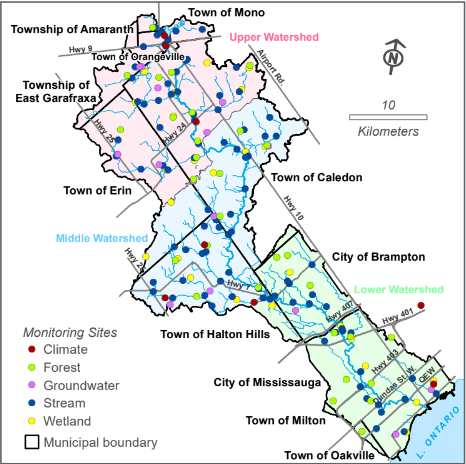
Where they monitor
The map below gives a clear idea of the locations where the watershed is monitored. The type of monitoring is classified using different color dots and municipal boundaries show different regions where it is monitored.
Use of GIS Tools
The application of GIS allows users and stakeholders to view current measurements and records in the form of maps from a bird’s-eye view.
Then: During the early years of the program, the team at CVC began collecting data using traditional notebooks and data sheets. As technology began to advance, CVC updated its tools. They eventually began storing the data using MS Access.
While part of the data is available as open data, the majority of the data is still kept in MS Access.
While the data was scanned, it was entered using digitizing or scanning tablets into MS Suite and GIS systems.
Now: Keeping pace with GIS advancements, CVC upgraded itself by using Enterprise GIS systems and data processing tools like ArcGIS Pro to make this monitoring program more effective. Site evaluation and data gathering are made easier with the help of mobile apps like Field Maps, ArcMap, and Kisters WISKI.
- Knowing the watershed’s boundaries and performing site inspections was made easier with the use of precise GIS map generation.
- Terrain elevation and the visual representation of data have made it easier to understand and anticipate trends and patterns. For instance, regularly keeping track of the temperature, quality, and fluctuations in water flow.
- Remote sensing is used to measure the health of the forest, the height of the canopy, and soil erosion along the watershed using municipal LIDAR or the base map data.
- Sharing with the community using IWMP’s StoryMap.
- When photos, videos, charts, and maps all need to be embedded to convey a message or tell a story about how CVC monitors the Credit River watershed, a story map is used.
- Showing historical temperatures by capturing climatic data from local climate stations and comparing it with current temperatures shows the impact of warming weather over the past 80 years.
- Story maps have proven to be a versatile way to convey recent information and raise public awareness.
CVC utilizes available data from organizations like:
- Ministry of Environment, Conservation, and Parks
- Environment Canada
- Water Survey of Canada
- Ontario Base Maps and related data from Land Information Ontario
- Municipal LIDAR or the base mapped data
Restore and ease Climate Change effect
Since the 1950s, CVC has been ambitious in its restoration projects. Since 2007, it has accelerated its efforts by planting millions of trees, controlling invasive species of plants, and rehabilitating forest, wetland, and grassland habitats.
CVC is preparing for an upcoming plan called the “Watershed Plan”. This plan will help people understand patterns of the past and plan for the future health of the watershed over the next 50 years. The plan will suggest a solution if any issues have been identified in areas of forest, wetlands, streams, or groundwater.
CVC has a comprehensive plan to build flood resilience around the Credit River Watershed. It includes:
- Predicting the flood and generating accurate early warnings.
- Accessible real-time weather and water level readings.
- Alerts and flood messages to the alert app users.
- Restoring habitat and combating climate change’s effects.
- Spreading awareness and educating private homeowners, farmers, businesses, institutions, and neighborhoods.
Acknowledgment
I would like to thank the CVC team, especially Loveleen Clayton, Manager, Landscape Science, Inventory, and Monitoring at Credit Valley Conservation, and Kamal Paudel, Manager, Information Management at Credit Valley Conservation and S. Lecturer of GIS/Analytics at the University of Toronto, for talking to me about this interesting program, answering my questions and providing me with information that is useful for this article. Again, many thanks.
References :
Government of Canada, Understanding Watersheds
CVC’s Integrated Watershed Monitoring Program StoryMap
Credit Valley Conservation’s Watershed Plan


Be the first to comment