
One of the highlights of Lidar CANEX 2025 was AI-driven Lidar mapping, along with a series of other intriguing topics. The premier B2B online forum held on January 29, 2025, brought together experts in Lidar and reality capture with practicing 3D professionals from Canada and beyond.
LidarCANEX is Canada’s premier annual event focused on the latest advancements in Lidar technology. Hosted virtually, the event brings together experts, professionals, and innovators in the geospatial industry to explore new techniques, tools, and trends that are shaping the future of Lidar and geospatial data. From AI-driven mapping to its applications in various industries, LidarCANEX serves as an essential platform for learning, networking, and discovering the cutting-edge of Lidar technology.
Tony St-Pierre, Forest Engineer and Surveyor, XEOS Imaging Inc., led us through an insightful seminar of hows and whys of AI-powered mapping.

Why did XEOS Imaging switch to AI-driven mapping?
Being built for large tasks, XEOS has been processing petabytes of data for years. However, due to the volume of point cloud Lidar data, it was increasingly becoming harder to work with due to following challenges:
- Merely a small section of Lidar data was available to be used, such as a digital terrain model (DTM).
- Due to the specific format of Lidar data, queries were unable to access a large amount of relevant data from other categories.
By adopting AI model driven mapping they were able to pull out data such as building footprints, tree crown data, blue spots, and so on from large amounts of Lidar data.
Quebec City-based XEOS Imaging specializes in collecting and processing high-resolution aerial photos and Lidar surveys.
How does AI-Driven Mapping work?
Working of AI-driven mapping explained in 3 simple steps:
- Classification of raw point cloud using AI models developed by the XEOS team could easily distinguish between pixels and classify them in various categories.
- Due to the outstanding performance of AI classifications, mapping of vegetation, power lines, blue spots, roads, buildings, bridges, and overpasses has become much accurate and efficient.
- Optional analysis enabled the automatic assessment such as the distance between vegetation and power lines. Similarly, blue spots analysis helps to predict flood zones during heavy rain.
Products built using AI-mapping
Tony St-Pierre discussed how the team at XEOS Imaging extracts different types of information from Lidar point clouds using an AI model. The information is generated in the form of a lightweight shapefile, which is easy to integrate. Let us look at the some products that have been developed over the last few years.
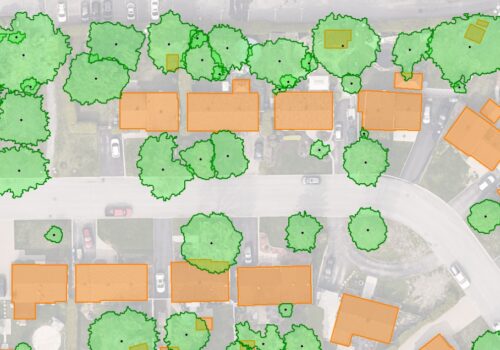
Building footprints: Building data is collected from Lidar point cloud, building by building in an extremely neat manner using AI. It is a polygon feature that has a projection of the roof from the ground. Attributes such as height and minimum altitude of flooring of the building are collected as well.
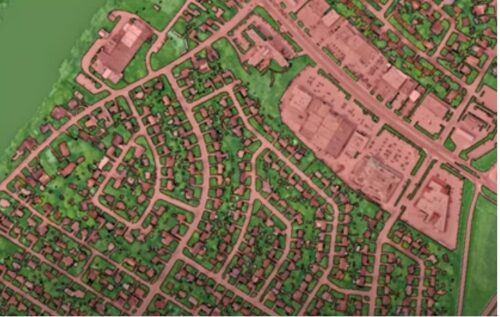
Ground Permeability/Heat Island: Below is the snapshot of overlaying the orthophoto with the shapefile generated using AI for heat islands, showing impervious ground in pink and permeable ground in green.
Vegetation: Vegetation has been mapped using height. Trees of different heights are extracted from Lidar data using artificial intelligence. They are then classified based on their height, ranging from <1.2 m to >3 m. Similarly, individual trees and hedges are mapped based on their height and crown area attributes that are associated with each polygon and point. The polygon represents each tree crown whereas, the point represents the centroid of each tree polygon. An AI model to classify the tree by its species is anticipated to become available next year.
Blue Spots: Using digital terrain model (DTM) extracted from Lidar, all the areas where water can accumulate during heavy rainfall were identified using slope. The depression slope is as deep as 30 m; the direction of surface water flow when the micro-watershed pushes the water to each depression is available. Likewise, the exact boundaries of water bodies, such as rivers and lakes that were present at the time of the Lidar survey, have been mapped.
LidarCANEX 2026
If you’re a LiDAR enthusiast or want to learn more, join us for LidarCANEX 2026 and keep an eye on the website: https://lidarcanex.com/.
And here is the sign-up form to get more information for LidarCANEX 2026 in your inbox.
Thank You to our Sponsors


Be the first to comment