
The oil and gas industry is undergoing one of the most significant digital transformations in its history. As technology advances, so too does the need for smarter, more user-centric software solutions that enhance operational efficiency, data analysis, and decision-making. A key part of this transformation is the rise of GIS (Geographic Information Systems) technology, which is helping to unlock new ways to manage resources, track assets, and improve sustainability.
However, despite these innovations, many software systems in the oil and gas industry still fail to prioritize user experience (UX). These tools are often built by technical people for technical people, leading to interfaces that are functional but lack intuitiveness and ease of use — especially for non-technical users in the field.
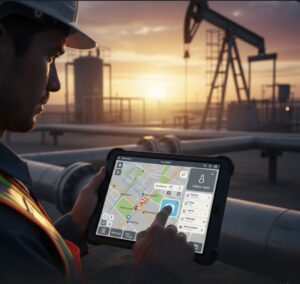
To address this gap, I am developing the Oil Well Tracker Tablet App which I will build over the next year. This prototype will focus on developing practical, user-friendly solutions while leveraging modern open-source software to power the front and back ends.
Not Full-Function Products: Purposeful Prototypes
It’s important to clarify that the Oil Well Tracker Tablet App will be a prototype, not fully production-ready application. The aim is not to deliver a complete, enterprise-grade system, but to explore and experiment with modern software tools, GIS capabilities, and user-centric design principles. The prototype will demonstrate concepts, workflows, and functionalities—helping to identify which approaches work best in oil and gas operations before fully building it out into a scalable solution.
For example, the Oil Well Tracker App will showcase features such as:
- Interactive maps to visualize well sites
- Mock data for carrying out different forms of well inspection
- Simulated offline functionality for field conditions
This prototype will focus on demonstrating innovative GIS and UX concepts, without the complexity of full backend integration or enterprise-scale infrastructure.
Built with Open-Source Tools: A Modern Tech Stack

The core of these prototypes will be built using modern open-source software—specifically tools in the JavaScript ecosystem for the front end and open-source GIS solutions for the backend. Here’s a breakdown of the tools I’ll be using:
Front End (User Interface)
- React: A powerful and flexible JavaScript library for building responsive, component-based web applications. React will be used to create dynamic, data-driven interfaces that can easily scale and adapt to different user needs.
- React Native: A framework for building mobile apps using the same React principles but compiling them into native code. This will enable me to deliver a smooth, performant experience on mobile and tablet devices.
- MapLibre: An open-source mapping library that allows for interactive maps to visualize spatial data. It provides flexibility to style and control the maps for different oil well or asset tracking needs.
Back End (Data Storage and Processing)
- GeoServer: A powerful, open-source server for serving geospatial data. GeoServer will handle the management and serving of spatial data (such as oil well locations, infrastructure maps, and environmental data) to the front-end applications.
- PostGIS: An extension of PostgreSQL that enables spatial database functionality. PostGIS will allow for efficient storage and querying of geospatial data, providing the backbone for the app’s spatial data handling, including well logs, production data, and maintenance records.
This combination of React, React Native, MapLibre, GeoServer, and PostGIS represents a modern, scalable, and flexible tech stack that’s ideally suited for developing interactive, data-driven GIS applications in the oil and gas industry.
UX-First Design: For Web, Tablet, and Mobile
One of the biggest challenges in oil and gas software is that it is often built by technical people for other technical users, without considering the end-user experience. This has resulted in clunky, unintuitive interfaces that are difficult to navigate, especially in the field where ease of use is critical.
My approach focuses on UX-first design across all platforms. The goal is to create solutions that are streamlined, intuitive, and responsive. This isn’t just about making things look good; it’s about ensuring that users can complete their tasks efficiently and effectively in the field using a tablet for inspections.

Key elements of the UX strategy include:
- Tablet-first design: Creating interfaces specifically for field workers using tablets, ensuring that mobile users aren’t dealing with cumbersome, web-based interfaces.
- Streamlined data visualization: Using interactive maps and clean, data-driven visualizations to display oil well performance, maintenance schedules, and other key metrics.
- Offline capabilities: Ensuring that the tablet versions of the apps can function without a constant internet connection, a crucial feature for remote fieldwork.
Join Me on the Learning Journey
This project is a learning journey as much as it is a development project. Throughout the year, I’ll be documenting my experiences with open-source GIS tools, modern application development, and UX design on LinkedIn. I’ll share insights, challenges, and progress updates as I experiment with new technologies and approaches to GIS in the oil and gas industry.
If you’re interested in GIS, open-source software, oil and gas technology, or digital transformation, I invite you to connect with me on LinkedIn and follow along with the journey.
The oil and gas industry is at the beginning of a long-overdue digital transformation. This is the perfect moment to build user-centric, GIS-based tools that not only leverage modern technology but also put the needs of the end user front and center. By combining open-source GIS tools, modern development frameworks, and UX-first design, I hope to contribute to a future where oil and gas software truly works for the people who rely on it most.


Be the first to comment