
What is the National Annual Crop Inventory?
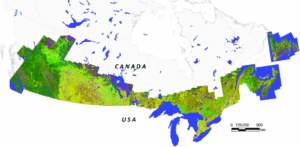
The inventory is a seasonal crop map produced annually that shows what types of crops are being grown across Canada. Covering every province and even a portion of Newfoundland, the inventory maps agricultural fields at 30-meter resolution. As Campbell emphasized, while 30 meters may not be considered ultra-high resolution in all fields, it is substantial for nationwide monitoring and involves processing over 3.4 billion pixels per year.
These maps are not limited to academic research or government use. They are freely distributed, empowering farmers, policy makers, environmental analysts, and private industry to make informed decisions about food security, environmental conservation, and land use planning.
A History Rooted in Research
Campbell traced the origins of the program back to the mid-2000s, when initial research was led by Dr. Heather McNairn and Dr. Catherine Champagne. At that time, the question was whether satellite-based crop classification could be reliably achieved in Canada. Drawing inspiration from similar initiatives in the United States (particularly through USDA), the Canadian team launched a five-year pilot study using five test sites across the country.
The goal was to evaluate if optical satellite data could deliver classification accuracies of 85 percent or higher. The findings were promising, and by 2008, AAFC determined it was not only feasible but also scalable. This laid the groundwork for the operationalization of the National Crop Inventory.
From Pilot to Production
Since those early days, the crop inventory program has grown into a full-fledged national initiative. Each year, AAFC produces and updates crop classification maps using a combination of satellite remote sensing and ground-truth data. The operational pipeline involves:
- Satellite data acquisition (primarily optical, such as Landsat and Sentinel-2)
- Field-level ground truthing and validation
- Machine learning and classification algorithms
- Post-processing, quality assurance, and public dissemination
This process is repeated annually, making the inventory one of Canada’s longest-running and most reliable remote sensing products in agriculture.
Real-World Impact
Campbell stressed the importance of the crop inventory in real-world applications. The inventory supports:
- Food security analysis by tracking national production trends
- Environmental monitoring, including land use change and habitat encroachment
- Carbon accounting and sustainability planning, especially relevant to climate policy
- Market forecasting and disaster response, particularly in drought or flood years
Beyond these, the inventory also plays a role in broader Earth observation initiatives. It feeds into continental-scale monitoring and supports partnerships with organizations like the Canadian Space Agency, Statistics Canada, and various provincial ministries of agriculture.
Open and Accessible
One of the defining features of the inventory is its openness. All data products are made available to the public at no cost. This democratization of data is consistent with Canada’s open science principles and has amplified the reach of the program well beyond government corridors.
From agricultural students conducting thesis projects, to global organizations doing food system modelling, to tech startups building AI models, this single, freely accessible dataset supports a wide range of stakeholders.
While Campbell’s presentation was grounded in technical achievements, it also hinted at the future. The continued integration of SAR (synthetic aperture radar), AI-based classification, and cloud computing platforms like Google Earth Engine promises to make the system faster, smarter, and even more accessible.
The program is also exploring more granular regional analysis and temporal stacking, layering data over multiple years, to track long-term agricultural trends and land degradation.


Be the first to comment