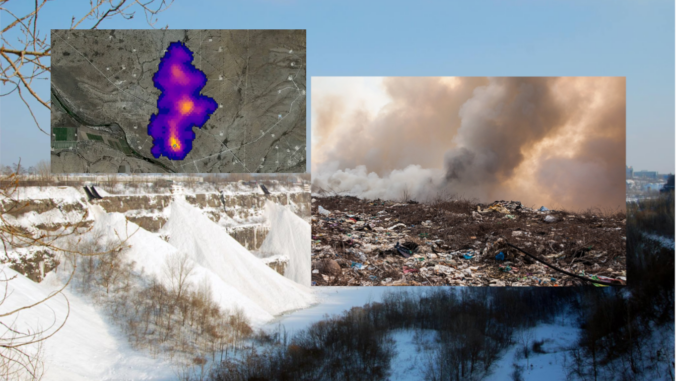
When McGill researchers mapped Montreal’s methane hotspots, they expected to find old landfills. Instead, they found a massive “super-emitter” in the city’s largest snow dump.
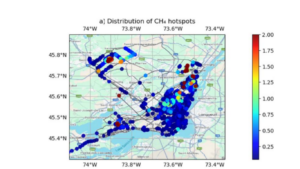
Densely populated urban centers are more than just hubs of human activity; they are significant concentrated sources of anthropogenic methane (CH4). To move beyond mere estimation, a four-year research study at McGill University deployed a mobile monitoring strategy to map the spatial distribution of methane hotspots across Montreal.
By equipping vehicles with high-frequency sensors and conducting rigorous surveys—covering three primary routes ten times each—the team generated a high-resolution geospatial dataset.
The results were definitive: the sensors recorded consistent data spikes that traced back to both active and historical landfills. These sites play a dominant role in the city’s emissions profile, venting substantial volumes of (CH4) into the atmosphere.
This study underscores a critical priority for urban climate policy: to mitigate methane effectively, cities must move past general estimates and use geospatial forensics to target specific waste management sites for immediate intervention.
Why is it important to reduce Methane emissions?
Methane is a powerful greenhouse gas. It is more than 28 times more potent than carbon dioxide (CO2) at trapping heat but has a short atmospheric life comparatively. Hence reducing methane from the atmosphere would significantly reduce atmospheric warming.
The key sources of methane emission includes landfills, oil and natural gas systems, agricultural activities, coal mining, stationary and mobile combustion, wastewater treatment, and certain industrial processes.
Montreal’s biggest methane source isn’t where everyone thought it would be. It was a “frozen” historical waste site which is actually a high-volume super-emitter hiding in plain sight.
The Geospatial “Sting”: Pinpointing Montreal’s Super-Emitters
Montreal being the second largest populous city in Canada, harbours largest source CH4 emissions – the waste sector. After the waste sector, the oil and gas sector is the second largest source of CH4 emissions, contributing 10% of total emissions.
Between 2019 and 2024, researchers used mobile surface measurements to map Montreal’s methane hotspots. By analyzing concentration spikes against local infrastructure, the study identified leaks from natural gas networks and quantified significant emissions from four major landfills. These geospatial findings highlight critical “super-emitters” necessary for targeted urban climate intervention.
Methods
The Mobile Survey: Four mobile survey campaigns were conducted across the city of Montreal and key off-island sites covering 3,300km. In all campaigns, the Atmospheric Composition and Environmental Survey (ACES) platform was utilized.
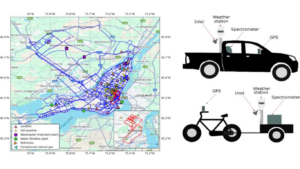
Mobile monitoring setup included a car, pick-up truck or a bicycle equipped with integrated CH4 analyzer, a weather station and GPS mounted on it.
Hotspot detection: Hotspot density and its detection was identified from the number of CH4 points obtained per kilometre of the surveyed routes at two spatial scales:
- By borough, using polygons representing political boundaries from the City of Montreal.
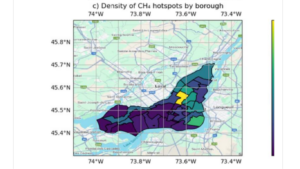

- Using a 1km x 1km grid.
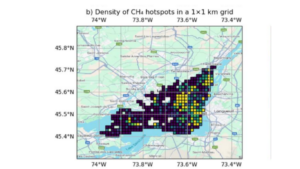

- Identified clusters of large CH4 hotspots were then handled by an algorithm that identifies dense region of data points such as isolated hotpots, without assuming predefined cluster number or shape.
Temporal variability analysis: To assess temporal methane variations, researchers conducted repeated 15 km bicycle surveys across Montreal from May to August 2024. Targeting aging residential infrastructure and the Lachine Canal, the study categorized hotspots by persistence. By clustering repeated detections within 50–200 meters, researchers distinguished chronic leaks from transient urban emissions.
Montreal’s largest CH4 hotspots concentrate around landfills
This 2025 study by Regina Gonzalez Moguel provides a high-resolution map of methane (CH4) emissions in Montreal. Over four years, researchers detected 3,045 hotspots, revealing that urban waste—not natural gas—is the primary driver of the city’s largest methane plumes.
Key Findings
- Waste Dominance: Large hotspots ($>1$ ppm) were almost exclusively linked to landfills. Surprisingly, the Francon Quarry snow dump was found to emit methane at rates comparable to active landfills, likely due to organic matter decomposition in meltwater.
- Natural Gas Leaks: Researchers identified 487 localized leak indications. These were most frequent in densely populated areas with aging infrastructure, particularly in Montreal’s east end.
- Persistent vs. Transient: Repeated surveys showed that 89% of hotspots were transient, suggesting many “leaks” are intermittent or mobile, whereas landfill emissions remained constant.
- Emission Quantification:
- Landfills: Estimated at 10,064–36,410 kg/day.
- Gas Leaks: Estimated at 250–507 kg/day.
Analysis of Sporadic Hotspots
The study’s temporal analysis reveals a “flickering” effect of methane sources in the urban core:
- Low Persistence: Only 11% of hotspots remained in the same 50m radius across multiple weeks. Even when widening the search area to 200m, persistence only reached 40%, suggesting that many sources are either mobile or short-lived.
- The “Random” Factor: Because researchers found no correlation between hotspot counts and variables like temperature or time, the emissions are likely driven by unpredictable activities rather than steady leaks.
- Likely Sources:
- Short-term Infrastructure Work: Temporary venting during gas line maintenance or construction.
- Sewer & Storm Drain Dynamics: Fluctuating water levels and organic decomposition that release gas intermittently.
- Mobile Sources: Compressed natural gas (CNG) vehicles or specialized industrial trucks.
Final Insights from the Study
- The “Invisible” Giant: Historical landfills and repurposed sites (like Parc Frédéric-Back) are the city’s largest underreported polluters. While infrastructure leaks are numerous, their cumulative volume is dwarfed by these legacy waste sites.
- Neighborhood Hotspots: High-density boroughs like Ville-Marie and Le Plateau-Mont-Royal are high-risk zones for natural gas leaks due to the intersection of aging infrastructure and heavy end-user demand.
- Strategic Priority: The research emphasizes that while fixing gas leaks improves safety, the most impactful climate mitigation lies in post-closure landfill management, such as enhanced biogas capture and biofiltration systems.
Next Steps for Montreal
Researchers suggest that the city should integrate mobile monitoring into its annual greenhouse gas reporting. By prioritizing the “top four” emitters—historical landfills, snow dumps, active waste sites, and dense urban gas networks—Montreal can move beyond estimates toward data-driven climate action.

Be the first to comment