Introduction:
Access to affordable and nutritious food is a privilege that many of us take for granted. However, as of 2022, Statistics Canada reports that 18% of Canadian households struggle with food insecurity, or a lack of sufficient and quality food that meets their basic needs (Uppal, 2023). A contributing factor to this insecurity is food deserts. Food deserts can be defined as areas where people have to travel abnormally long distances to purchase healthy and inexpensive food. In other words, grocery stores, supermarkets, and farmers markets are non-existent in these regions. Food deserts can be present in both urban and rural settings and predominantly consist of low-income families. The U.S. Department of Agriculture found that in 2009, 23.5 million US residents lived in low-income areas more than 1 mile from a large grocery store (USDA, 2009). On top of that, many of these families do not have a household vehicle, indicating that quality public transit is a barrier to food accessibility. Moreover, food deserts tend to fall along racial lines with black neighborhoods having 4 times less supermarkets than white neighborhoods (Morland et al., 2002). Because of the long commute times to grocery stores, people living in food deserts tend to choose unhealthier food options that are more convenient such as fast food, which can lead to health complications like obesity and chronic diseases (National Research Council, 2009).
Minimum Commute Distance:
In order to identify and eliminate food deserts, GIS can be used to visualize and determine areas where individuals would have to commute more than a certain distance or number of minutes to grocery stores, supermarkets, and other establishments with affordable and quality food, yet there are many approaches. Firstly, depending on whether the study is conducted in an urban or rural location, the minimum commute distance required to classify an area as a food desert and assumed transportation method varies. Research conducted in urban areas tends to use 500 meters as their minimum commute distance when it is assumed that individuals walk to pick up their groceries (Slater et al., 2017). In rural areas, everyone likely has access to a vehicle, so the minimum commute distance is more like 8 to 10 miles (McEntee and Agyeman, 2010). The choropleth map below indicates food desert regions, with a minimum distance of over 10 miles, in rural Vermont.
Food Desert Regions in Rural Vermont:
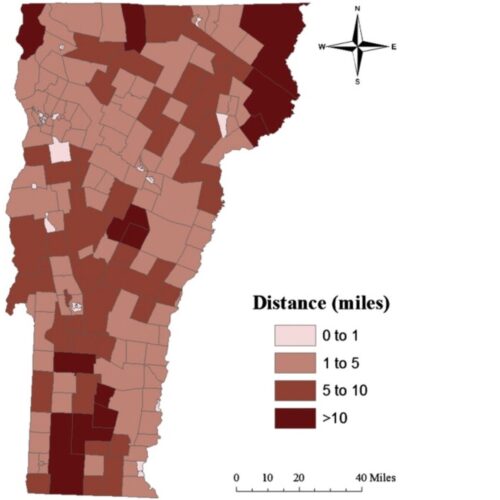
McEntee and Agyeman, 2010
For urban and suburban studies where public transportation is considered, a time limit is normally used over a distance measurement. A paper looking at food deserts in London, Ontario considered a 10 minute bus ride (without transfers) coupled with a 500 meter walk as their accessibility measurement (Larson and Gilliland, 2008). The image below shows the map they used with bus routes and supermarkets.
Bus Routes and Supermarkets in London, Ontario
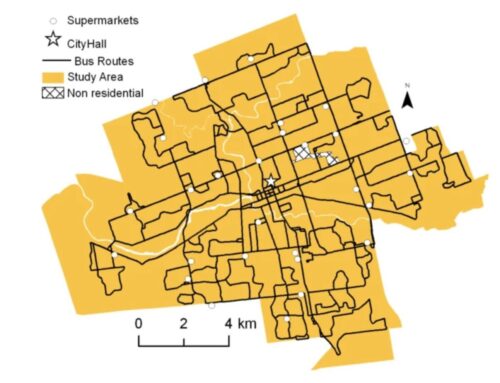
Larson and Gilliland, 2008
Distance Calculations:
Different GIS tools are used to calculate these distances. A study conducted in rural Vermont used the “Network Analyst Extension Closest Facility” feature in ArcMap 9.2 to determine the closest grocery store by sidewalk travel (McEntee and Agyeman, 2010). An example of this tool being used for a residential unit in Vermont is depicted in the image below. The same feature was used to look at public transportation distance in the London, Ontario study (Larson and Gilliland, 2008). Since the road and public transportation networks are included in analysis, the commute time is more accurately reflected.
Network Analyst Extension Closest Facility for a Residential Unit in Rural Vermont:
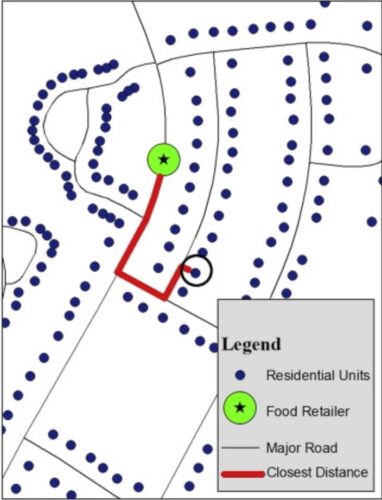
McEntee and Agyeman, 2010
Contrarily, a study conducted in Winnipeg focused on urban and suburban regions and chose to use geodesic distance instead of network connectivity (Slater et al., 2017). While this might be faster because it only requires the creation of 500m buffers around grocery stores, it likely underestimates the actual commute distance. Their identified food deserts are depicted in the map below.
Food Deserts in Downtown Winnipeg Using Geodesic Distance
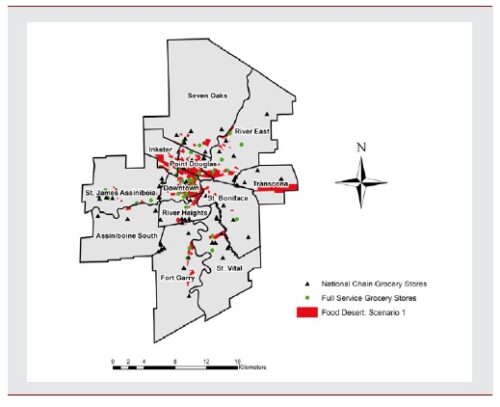
Slater et al., 2017
Selection of Food Providers:
Accessible food providers are also defined differently between papers. Some chose to set a size limit on food establishments to rule out convenience stores and gas stations selling less nutritious food (McEntee and Agyeman, 2010). Others consulted local dieticians, business directories, yellow pages, and phone calls to retailers to confirm their choices of accessible food providers (Slater et al., 2017; Larson and Gilliland, 2008). While setting a minimum size is the quickest method for determining food providers, consulting the local community likely results in greater accuracy.
Conclusion:
The ability to consume nutritious and affordable food is a basic right for all human beings, but the presence of food deserts make that difficult for many people, particularly those in low-income communities. GIS is a powerful tool that can be used to identify food deserts in urban and rural settings as well as the optimal route individuals can take to reach adequate food providers. While it is obvious that the exact definition of a food desert varies based on context, it is evident that a network-based approach that integrates local transportation networks and expertise on food establishments is most effective at pinpointing food deserts. By identifying these regions using GIS, policymakers and urban planners can better execute changes to improve food security.
References:
Larsen, K., & Gilliland, J. (2008). Mapping the evolution of “food deserts” in a Canadian city: Supermarket accessibility in London, Ontario, 1961–2005. International Journal of Health Geographics, 7(1), 16. https://doi.org/10.1186/1476-072x-7-16
McEntee, J., & Agyeman, J. (2010). Towards the development of a GIS method for identifying rural food deserts: Geographic access in Vermont, USA. Applied Geography, 30(1), 165–176. https://doi.org/10.1016/j.apgeog.2009.05.004
Morland, K., Wing, S., Diez Roux, A., & Poole, C. (2002). Neighborhood characteristics associated with the location of food stores and food service places. American Journal of Preventive Medicine, 22(1), 23–29. https://doi.org/10.1016/s0749-3797(01)00403-2
National Research Council (US). (2009). The Public Health Effects of Food Deserts: Workshop Summary. Nih.gov; National Academies Press (US). https://www.ncbi.nlm.nih.gov/books/NBK208018/
Slater, J., Epp-Koop, S., Jakilazek, M., & Green, C. (2017). Food deserts in Winnipeg, Canada: a novel method for measuring a complex and contested construct. Health Promotion and Chronic Disease Prevention in Canada, 37(10), 350–356. https://doi.org/10.24095/hpcdp.37.10.05
U.S. Department of Agriculture. (2009). Access to Affordable and Nutritious Food. https://www.ers.usda.gov/webdocs/publications/42711/12715_ap036_reportsummary_1_.pdf?v=0
Uppal, S. (2023, November 14). Food insecurity among Canadian families. Statistics Canada. https://www150.statcan.gc.ca/n1/pub/75-006-x/2023001/article/00013-eng.htm


Be the first to comment