
Wildfires are raging across Canada — from British Columbia to Nova Scotia — in what is fast becoming another catastrophic fire season. Hot, dry weather and shifting wind patterns are converging to create another intense wildfire season — just two years after Canada recorded the worst fire season in its history. In some places, they are hitting earlier than expected. In others, they have barely stopped burning since last year. Saskatchewan and Manitoba are under state of emergency while thousands have been forced to flee their homes as dozens of fires burn out of control.
More communities are under threat. More people are breathing in smoke. And more emergency crews are being pushed to their limits.
In this emergency and chaos, geospatial data and platforms are proving to be one of the most important tools for understanding what’s happening, where, and how fast.m
The Race for Real-Time Data
Fire behavior can shift dramatically in a matter of hours. That’s why the ability to track fires in near real-time — from new ignitions to shifting smoke — has never been more critical. Traditional ground reports, while essential, are no longer sufficient. Where to send water bombers. When to evacuate. Whether to close a highway. You can’t make those calls with yesterday’s data.
The ability to monitor fires in near real time — detecting new ignitions, tracking spread, and forecasting smoke movement — now depends heavily on satellite imagery, predictive models, and online geospatial platforms. Several national, provincial, and academic systems are working in parallel to provide up-to-date wildfire intelligence. These tools — live maps, satellite images, smoke forecasts — are not only helping governments deploy resources more effectively, but are also giving the public better access to timely, actionable information. They help fire crews decide where to draw lines and cities to issue alerts. They help public health teams track smoke exposure, and northern communities act fast when help is hours away.
The Big Picture
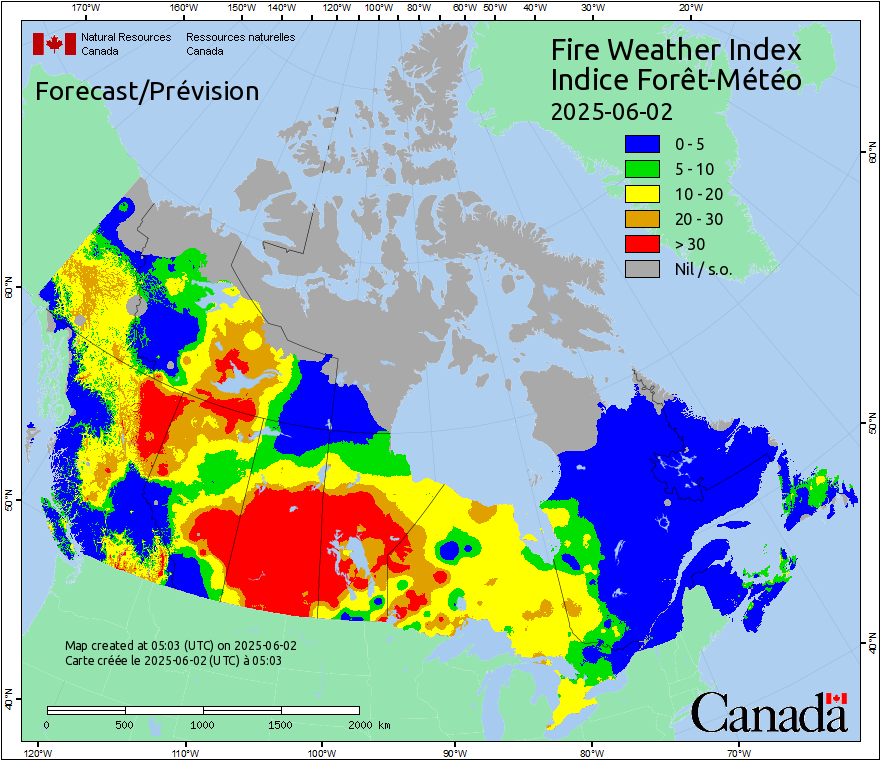
The real power of geospatial intelligence lies in its ability to translate observation into action. The Canadian Wildland Fire Information System (CWFIS) is Canada’s main public fire dashboard. Managed by the NRCan, it is updated daily and includes fire danger ratings, weather forecasts, and an interactive map showing active fires, lightning activity, and thermal hotspots detected by satellites. The system covers all provinces and territories, making it the go-to source for nationwide situational awareness.
Fire M3 Hotspots, a specific interactive map layer within CWFIS, is focused solely on hotspot detection. It uses satellite data from MODIS and VIIRS instruments to detect thermal anomalies (hotspots), and indicates potential fire activity in near real-time. The goal is fast detection of emerging fires, especially in remote regions.
Complementing CWFIS is NASA’s FIRMS (Fire Information for Resource Management System), which uses MODIS and VIIRS satellite instruments to deliver near real-time fire detections globally, including detailed overlays for Canada. FIRMS’ thermal imagery can detect smaller fires in remote areas, providing early warning where ground reporting is delayed. The MODIS and VIIRS satellites capture full-color images of wildfire zones in Canada — scorched land, glowing hotspots, thick smoke stretching across provinces. These images are regularly used by wildfire agencies, scientists, journalists, and residents to understand both scale and spread.
For more technical tracking, groups like the Cooperative Institute for Research in the Atmosphere (CIRA) create time-lapse animations. These visual satellite animations track wildfire smoke and atmospheric effects across North America, and are especially helpful in understanding transboundary smoke movement — like how fires in British Columbia affect air quality in Alberta, or how Quebec’s fires impact Ontario and even northeastern U.S. states.
Provincial and Territorial Initiatives
Each province maintains its own wildfire portal– many with additional tools that provide live fire locations, intensity levels, evacuation alerts, and other real-time information to help the public respond quickly during fire emergencies.
Each provincial portal often connects with or draws on federal satellite feeds, providing a blend of high-altitude imagery and local response intelligence. Provinces like BC, Alberta, Quebec, and Manitoba also work with commercial providers such as Maxar, Planet, and others for high-cadence imagery that are updated daily. This data is being used to identify vegetation stress, assess post-burn damage, and monitor inaccessible areas where ground teams cannot safely go. Private players such as Esri Canada also provides up-to-date wildfire data with frequently refreshed active and historical layers to support decision-making.
Ontario
- Ontario Forest Fires: Gives information about the current forest fire danger, forest fire activity and fire restrictions across the province.
- Forest fire interactive map: The interactive fire map provides the forest fire danger rating as calculated by over 130 weather stations across Ontario’s Fire Region. This changes throughout the day to reflect up to date weather information.
- Fire management offices: General contact information for your local fire management or other offices.
- Forest fire danger ratings: The interactive fire map provides the forest fire danger rating as calculated by over 130 weather stations across Ontario’s Fire Region. This changes throughout the day to reflect up to date weather information.
Alberta
- Alberta Wildfire maps and data: Gives wildfire locations on an interactive map and view current year statistics, fire danger and fire ban information.
- Alberta Wildfire Status: Find active wildfires on the wildfire map and dashboard, see wildfires of note and find the latest forest area updates.
British Columbia
- BC Wildfire Service Dashboard: Live map showing current wildfires, evacuation alerts, and perimeters. When data becomes available, it is refreshed from operational systems every five minutes to the public map.
- BC Air Quality Health Index: Real-time air quality data integrated with wildfire activity.
Quebec
- SOPFEU Fire Map: Displays active fires and suppression efforts, including satellite-derived burn perimeters.
Manitoba
- FireView: Public tool showing current wildfires, containment updates, and thermal detection overlays.
Nova Scotia
- Wildfire Nova Scotia Viewer: Provides location of wildfires and fire weather.
New Brunswick
- Fire Watch: Gives Information on wildfire activity, safety, prevention, campfires and burning permits.
Newfoundland and Labrador
- Fire Hazard Map: The Fire Hazard map is intended for general public information and outlines the risk of wildlfires.
Saskatchewan
- SPSA Wildfire Dashboard: Interactive map of active fires, including updated perimeter data and proximity to communities.
Yukon
- Yukon Wildfires: Updated maps with perimeters and real-time incident data.
Northwest Territories
- NWT wildfire update: Gives updates for confirmed details about wildfire risk and response.
PE Island and Nunavat
Do not have a dedicated, real-time wildfire map like some larger provinces. However, emergency responders and residents can access several national geospatial platforms to monitor wildfire activity and smoke conditions.
Smoke Forecasting and Air Quality Models
One of the most disruptive effects of wildfire isn’t fire — it’s smoke. Last year, parts of Ontario, Quebec, and even New York City choked under thick haze from distant blazes. This year looks no different.
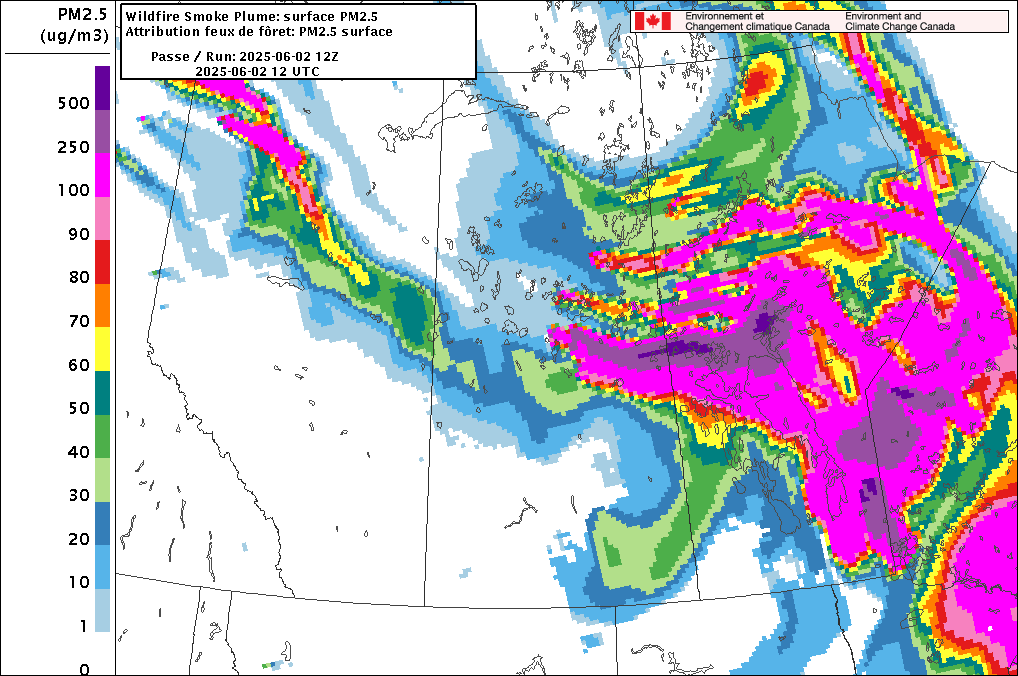
Environment and Climate Change Canada’s FireWork is a high-resolution forecasting system that predicts the movement of wildfire smoke across Canada. It simulates how smoke travels through the atmosphere over 48 to 72 hours using satellite fire detections, weather patterns, and emissions data. FireWork helps inform public health alerts, air quality forecasts, and emergency planning by estimating the concentration of fine particulate matter (PM2.5) at ground level.
FireSmoke Canada is another public web platform that visualizes the data produced by the FireWork model. Built by researchers at the University of British Columbia in collaboration with the Environment and Climate Change Canada, the tool presents animated maps showing where wildfire smoke is expected to travel and how dense it may become over time. Designed to be easy to understand, FireSmoke Canada is used by the public, media, and educators to track smoke forecasts and make informed decisions about outdoor activities.
Then there are private initiatives like IQAir, which combines air quality sensors and wildfire data and geospatial overlays to show which communities are facing elevated particulate matter exposure due to wildfires, which is essential for public health decision-making, for instance whether it is safe to step outside or send your child to school.
What’s Coming: Canada’s Own Fire Satellite
Until now, most of Canada’s wildfire imagery has come from international satellites. That’s about to change. WildFireSat is a Canadian satellite currently under development by the Canadian Space Agency, in partnership with Natural Resources Canada and the Canadian Forest Service. It’s the first satellite designed specifically to monitor wildfires on a national scale, and is scheduled to be launched in 2029.
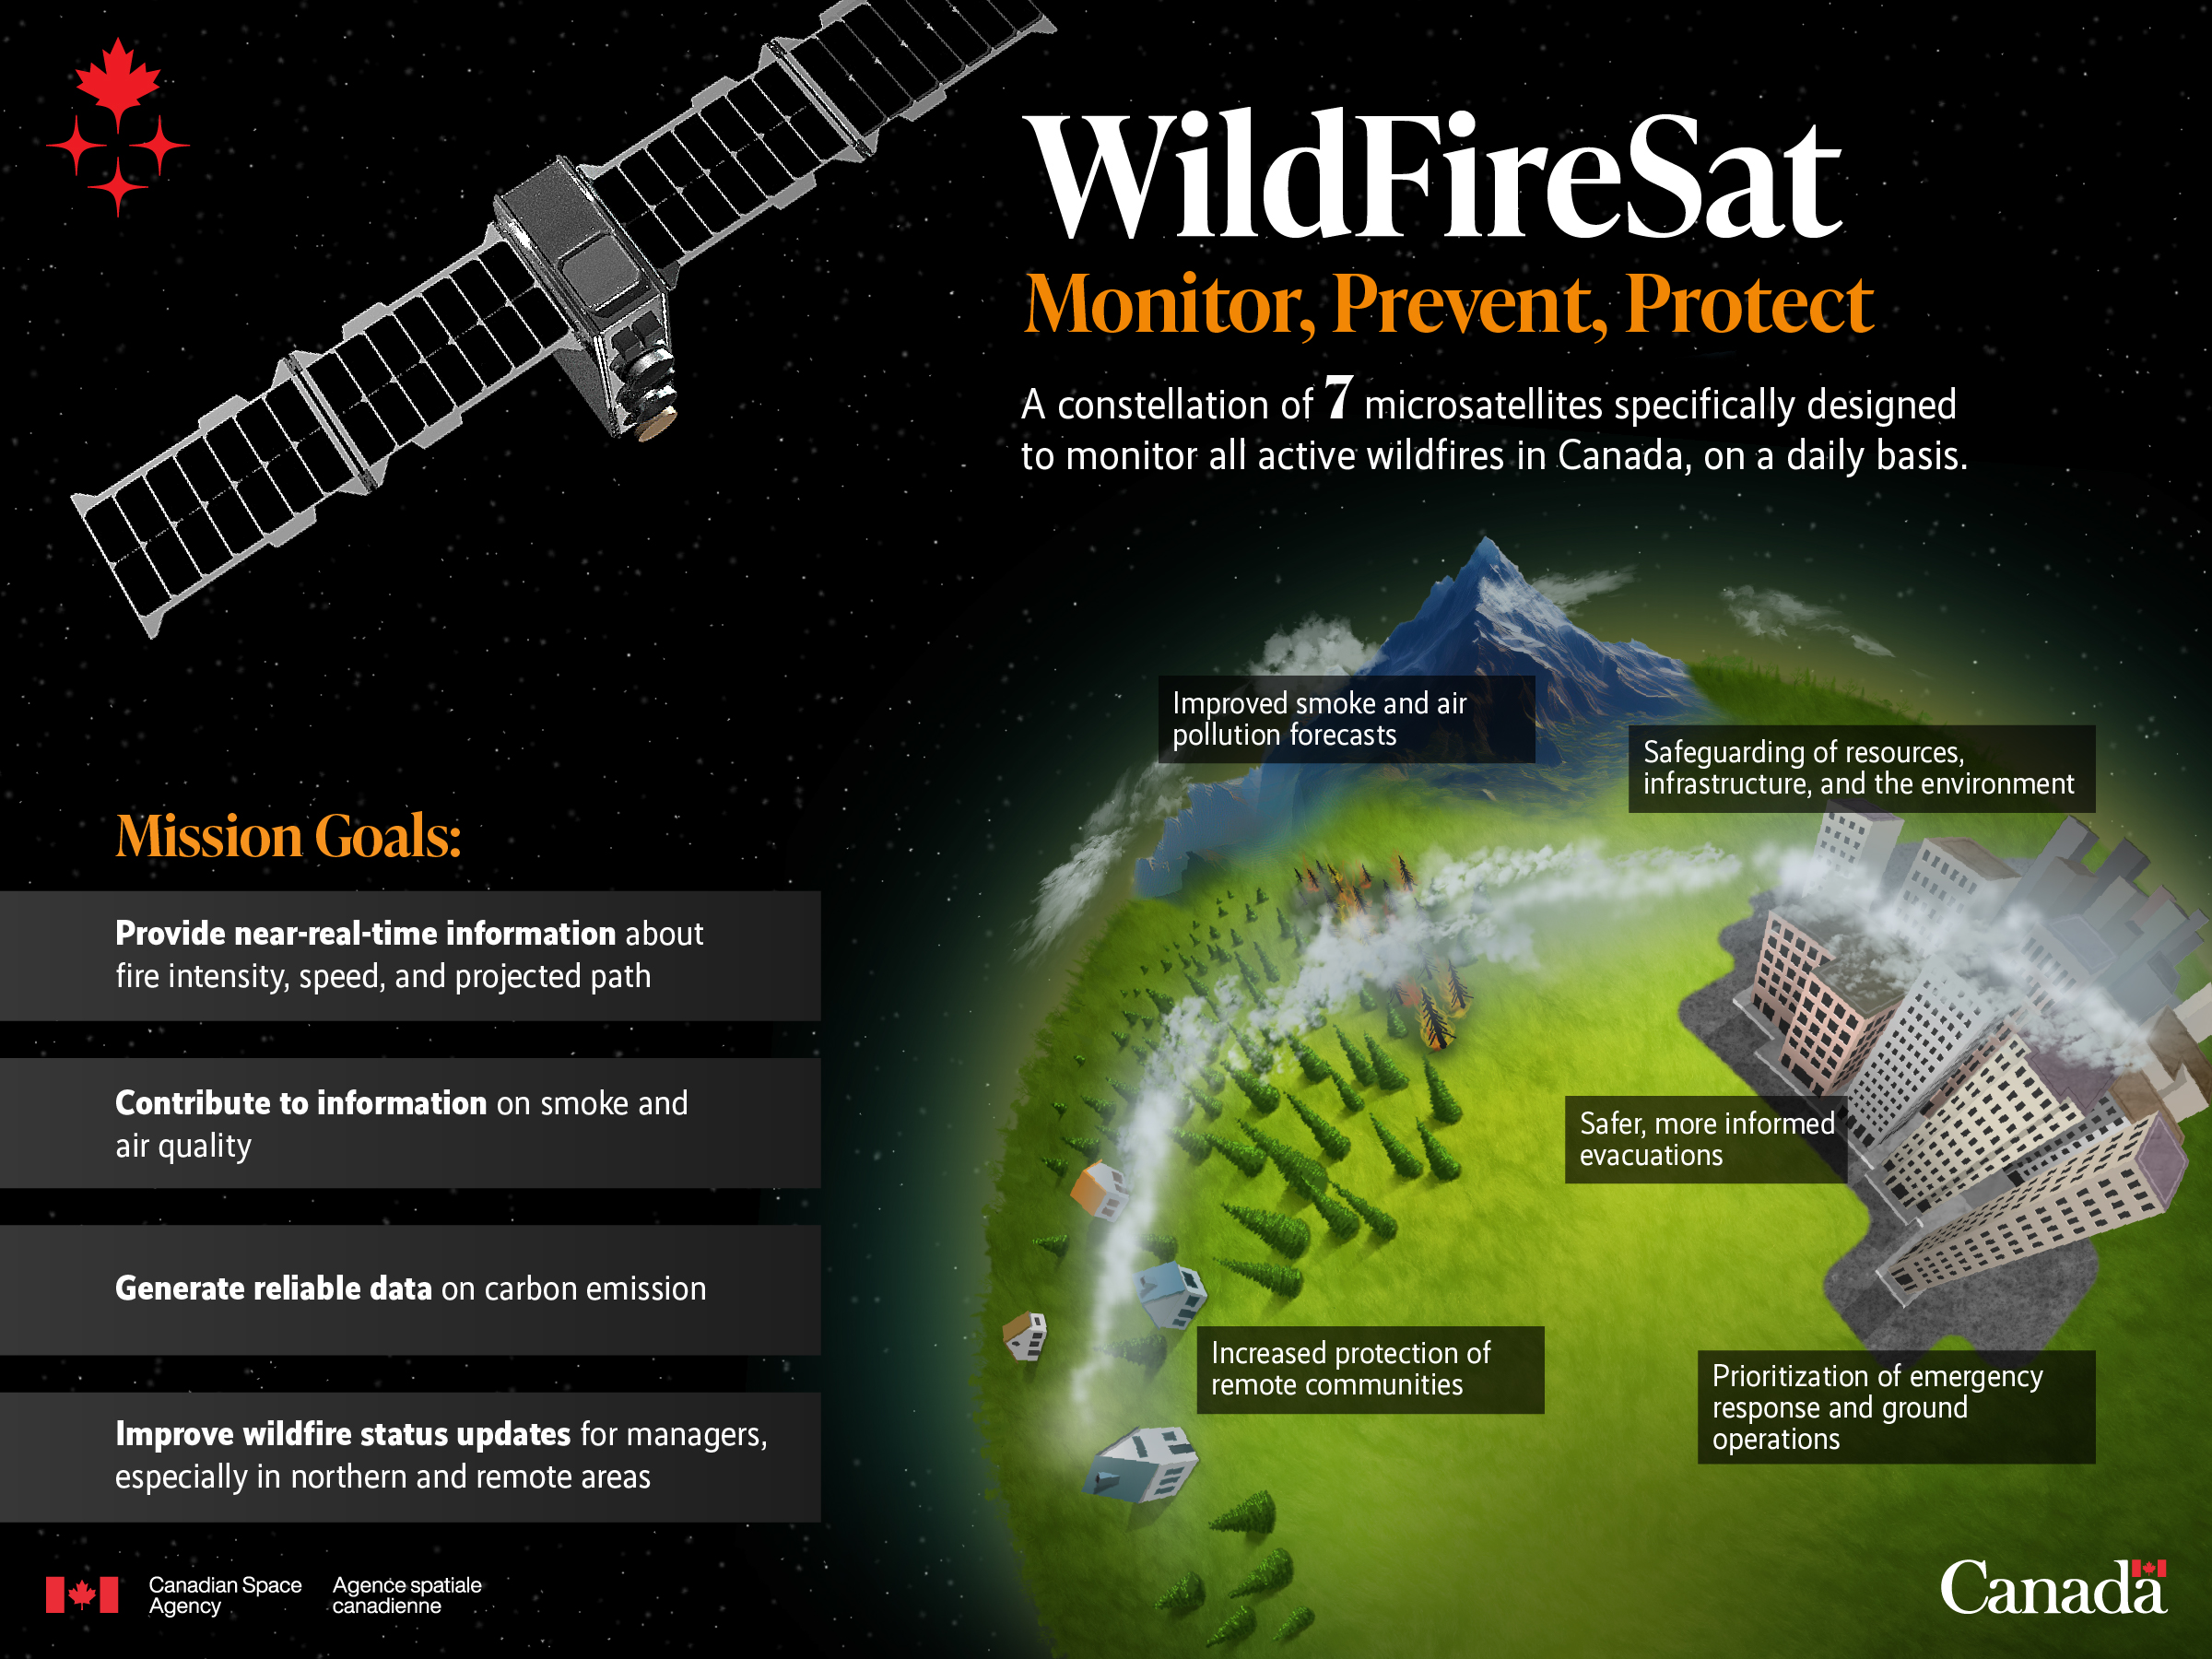
WildFireSat will pass over Canada in the late afternoon — when fires tend to flare up — and use thermal sensors to measure fire intensity and smoke emissions. This data will improve wildfire modeling, enable faster response, and support greenhouse gas accounting by capturing fire-related emissions with greater accuracy.
Once launched, WildFireSat will become a critical piece of Canada’s domestic geospatial infrastructure, delivering targeted wildfire intelligence for public safety, resource management, and climate resilience.
From Crisis Monitoring to Community Resilience
As wildfires become a year-round concern in many parts of Canada, these geospatial tools are not just for immediate response — they are becoming foundational to long-term adaptation strategies. Planners are using fire risk models to inform land-use decisions. Forest managers are integrating remote sensing into reforestation planning. Insurance firms are turning to satellite data to assess damage and exposure.
The shift is clear: wildfire response in Canada is no longer just about boots on the ground — it’s about satellites in the sky, data in the cloud, and rapid decision-making on every screen.
When the next fire ignites — and it will — it’s geospatial infrastructure that will help determine how prepared we are.


Be the first to comment