Content and Growth of Municipal Open Data Catalogues
The open data movement has been the talk of the nation, encouraging transparency of governance and good management of data. Goodness, what a magical moment it must be to witness the head of a government department say yes to publishing their data. The supply and demand sides of municipal open data have given rise to new research on the mechanisms in which it operates.
The present research was informed by a comprehensive analysis of “The Role of Canadian Municipal Open Data Initiatives: a Multi-city Evaluation”, a Master’s thesis written by Liam James Currie in August 2013. Currie’s research included an inventory of 23 municipal open data catalogues across the country, which was compiled in December 2012. Specifically, the inventory distinguished geographic and geospatially formatted data, which became an area of interest.
The author of these lines completed a partial reiteration of the inventory in December 2013, with funding from the Social Sciences and Humanities Research Council (SSHRC) under the GeoThink Partnership Grant. This study focused on the changes in geographic content, growth and user interface of 11 catalogues. Nine of the 11 are among the 23 open data catalogues investigated by Currie. The 11 catalogues were chosen from municipalities participating in the GeoThink project.
Geographic content is defined as being a dataset which (regardless of file format) contains information such as addresses, coordinates, neighbourhood names or the “controversial” postal code. Geospatially formatted data is restricted to the file formats of KML, KMZ, DWG, and SHP (Esri Shapefile).
Along with collecting and analyzing the catalogues, this research also looked at how open data was presented in regards to GIS-like functions available to users. This also included an evaluation of geo-inclusivity or how geographic information is effectively shared to cater to all skill levels.
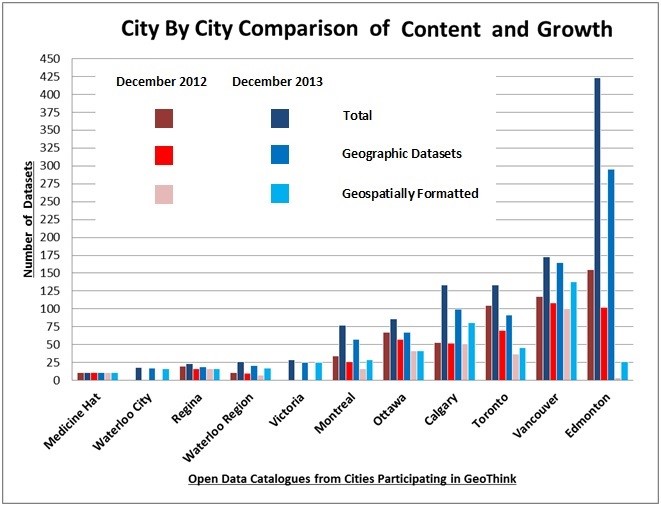
Below is a chart and bar graph of the facts and figures of the 2013 inventory compared to 2012. Victoria and the city-only catalogue for Waterloo were not included in the 2012 research. The annual inventory will be repeated for December 2014, adding a thematic perspective as well as additional regional and municipal open data catalogues from across Canada.
| City | December 2012 | December 2013 | ||||
| Total | Geographic
Data |
Geospatially
Formatted |
Total | Geographic
Data |
Geospatially
Formatted |
|
| Edmonton | 155 | 102 | 4 | 423 | 295 | 26 |
| Vancouver | 117 | 108 | 100 | 173 | 165 | 138 |
| Toronto | 105 | 70 | 37 | 133 | 91 | 46 |
| Calgary | 53 | 52 | 51 | 133 | 99 | 81 |
| Ottawa | 67 | 57 | 41 | 86 | 67 | 41 |
| Montreal | 34 | 26 | 16 | 77 | 57 | 29 |
| Victoria | 0 | 0 | 0 | 29 | 25 | 25 |
| Waterloo Region | 11 | 10 | 7 | 26 | 21 | 17 |
| Regina | 20 | 16 | 16 | 23 | 19 | 16 |
| Waterloo City | 0 | 0 | 0 | 18 | 17 | 16 |
| Medicine Hat | 11 | 11 | 11 | 11 | 11 | 11 |


