Alex Trebek honoured with Geographical Society grant program for emerging explorers
The National Geographic Society in the United States and the Royal Canadian Geographical Society are collaborating to create a grant program that will provide $400,000 – $500,000 annually to support exploration projects in Canada. The Trebek Initiative was created to honour the Jeopardy host who had been involved with both the National Geographic Society and the Royal Canadian Geographical Society. The purpose of this program is to assist up and coming Canadian educators, photographers, scientists, and explorers. The funding will come from 18 families across the country and will fund 10 to 12 grants per year. The grant program has already received some interesting applications, such as, looking at underwater caves in British Columbia, doing scientific research on the wildlife in Canada, looking at water scarcity in northern communities and many more.
Article can be viewed here.
Clear Seas Launches Interactive Mapping Dashboard That Visualizes Marine Shipping Safety in Canada
An interactive map by Clear Seas is looking at Canadian marine shipping safety. This publicly available map is the first of its kind that shows marine shipping accidents and incidents in Canadian waters. The Executive Director of Clear Seas, Paul Blomerus, expresses the importance of looking at past events to better asses the risk for future events and to make marine shipping in Canada much safer. While creating this dashboard, Clear Seas analyzed upwards of 14,000 reports of marine events involving vessels from January 2009 to December 2018. The map looks at incidents involving cargo ships, ferries, tugboats, barges, and cruise ships.
Article can be viewed here.
Free new Canadian app detects and maps forest fires to improve response and public safety
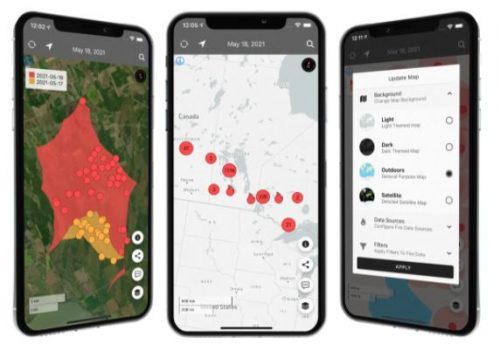
There’s a new app that can detect and map wildfires across Canada. The FireFringe app is available for free to anyone who wishes to use it, this includes, Canadian firefighters, emergency managers, forestry managers, municipalities and anyone in the media or the public. This app is updated on a regular basis and provides data in near real time. The app uses SkyForest Technology, which creates detailed maps of forests using satellites, this satellite data is then put together with NASA’s satellite sensors that can detect high temperatures. Natural Resources Canada’s data is also included to highlight the wildfire perimeters and wildfire hotspots. The FireFringe app can assist with understanding what might be giving the wildfire its power, observe how the fire is progressing and help improve wildfire predictions. You can download the app for free on GooglePlay, the App Store and HUAWEI AppGallery.
Article can be viewed here.
Vancouver’s Shady Inequality
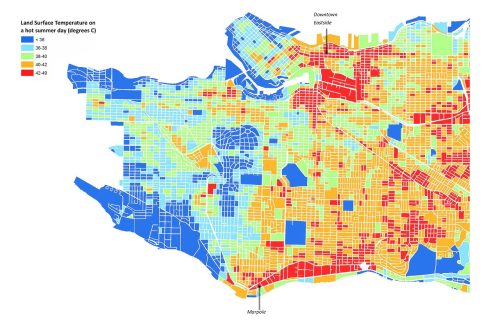
A map from the Urban Forest Strategy shows the inequality faced in some Vancouver neighborhoods during heat waves. Although this map was created in 2018, it is more relevant now than ever as Vancouver is once again under another heat warning and just last month experienced a ‘Heat Dome’ that caused some of the hottest temperatures the region has ever seen. This detailed map highlights which parts of Vancouver experience the hottest land surface temperatures during a hot day. This map highlights the differences that exist throughout the city as some places have a lot of greenery and shade, those are the places that typically have a land surface temperature of below 36 degrees Celsius, while others that are lacking shade and green spaces can reach 42-49 degrees Celsius. The Downtown Eastside is one of Canada’s most vulnerable neighborhoods and according to this map has some of the hottest land surface temperatures in the city which only adds to an already extremely vulnerable population. This map highlights the importance of green spaces in the community especially during a hot summer day.
Article can be viewed here.
A Collection of Canadian COVID-19 Dashboards
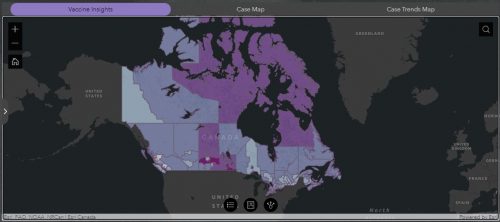
Esri Canada has created a GIS Hub that provides up to date information about the pandemic. There are many dashboards that include important statistics and spatial information about vaccines, cases, and case trends. They also have links to many Canadian provincial and municipal dashboards that provide information relating to COVID-19.
Dashboards can be viewed here.



Be the first to comment