
- Water Pollution in Ireland
- Ocean Cleanup with the Plastic Tracker
- Environmental Defence Fund’s MethaneSat
- Mapping Where Tree Planting is Most Effective
- Missing BC Groundwater
- Mapping the Health Effects of Climate Change in Alberta
- An Earth Day Letter from Jack Dangermond
- Bonus Map: Climate Issues Worldwide
Water Pollution in Ireland
Esri Ireland has teamed up with the Dublin Urban Rivers LIFE (DURL) Project to tackle water pollution in Dublin’s rivers. Using ArcGIS, DURL has identified and fixed over 1,000 misconnected household appliances, resulting in a significant reduction in pollution. Real-time data collection has doubled the project’s efficiency, leading to a 50% cost reduction. The success of the project has prompted the development of a simplified ArcGIS solution for other urban councils in Ireland and Europe. Briana Shiels and Lorraine Beirne from DURL emphasize ArcGIS’s role in efficiently identifying misconnections, while Dermot O’Kane from Esri Ireland highlights the project’s positive impact on Dublin’s rivers and aquatic biodiversity. Read more here.
Ocean Cleanup with the Plastic Tracker
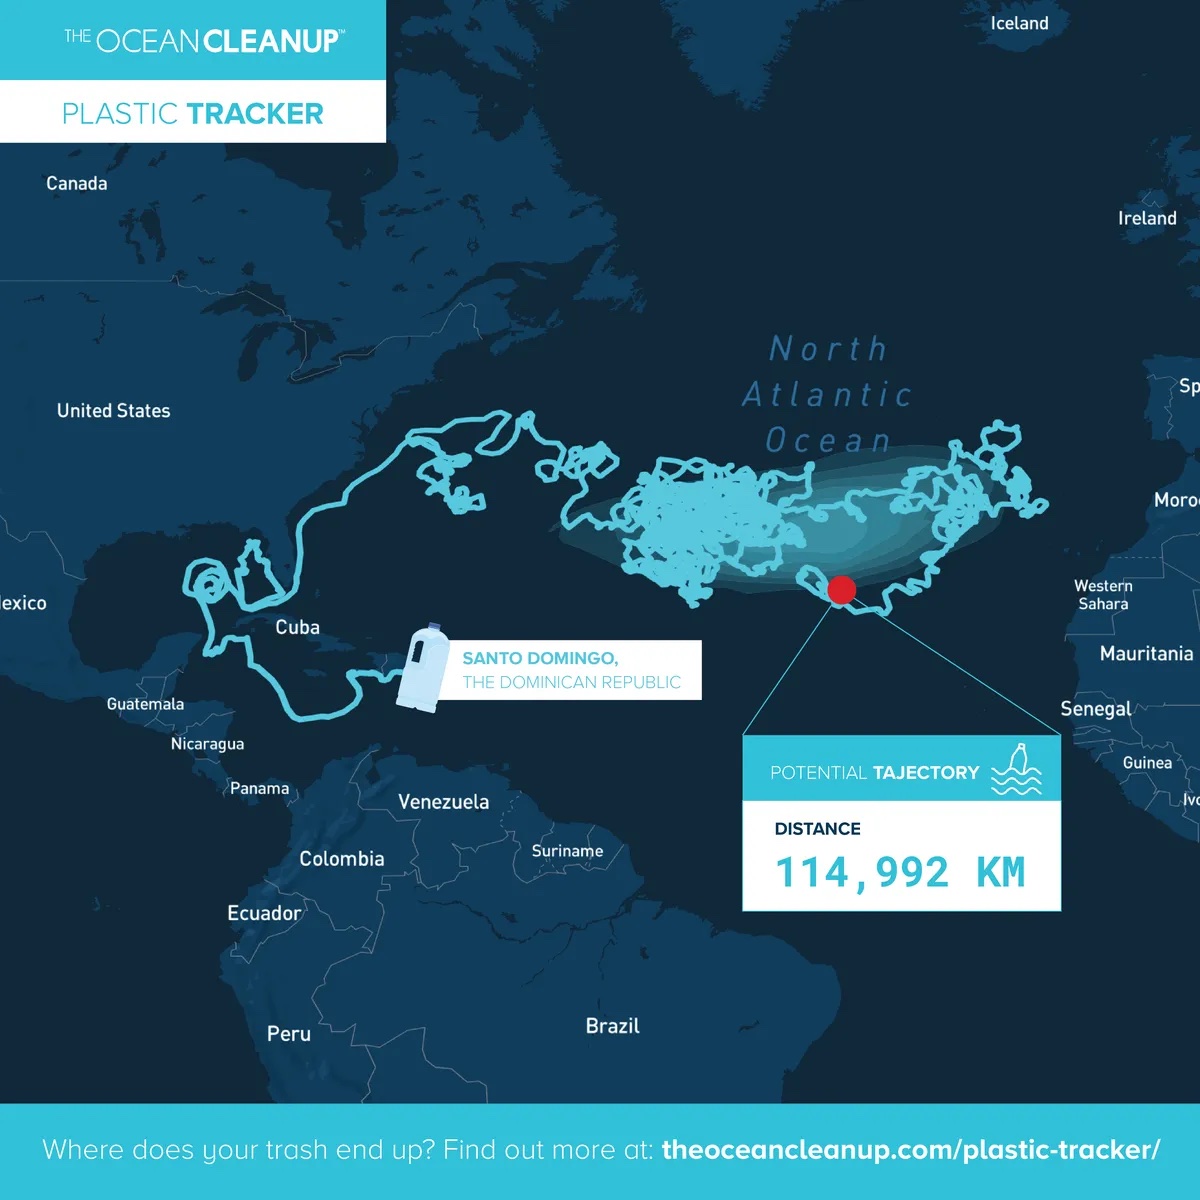
The Ocean Cleanup has developed the Plastic Tracker, a web application that visualizes the trajectory of plastic pollution. It shows how and where abandoned plastic can end up if improperly discarded. The tool raises awareness about the severity of the plastic pollution crisis and encourage individuals to take action. By using dispersion models and river data, the Plastic Tracker predicts plastic trajectories in the ocean and calculates the probability of plastic reaching waterways. While it doesn’t provide absolute certainty, it serves as a powerful educational tool and a call to action. Users can contribute to the fight against pollution by safely disposing of trash and supporting efforts to clean up the oceans. Read more here and view the tracker here.
Environmental Defense Fund’s MethaneSat
Google has partnered with the Environmental Defense Fund (EDF) to reduce methane emissions using satellite data, algorithms, and AI. EDF’s MethaneSAT satellite will collect precise methane emissions data, which, combined with Google’s AI and Cloud computing, will identify and trace methane sources from oil and gas infrastructure worldwide. The satellite will orbit the Earth, measuring methane levels in key regions. Google’s AI will also map oil and gas infrastructure, allowing for a detailed understanding of emissions sources. This information will be made available through Google Earth Engine, enabling researchers and organizations to track methane emissions and their environmental impact over time. This collaboration aims to address one of the most pressing climate challenges by providing actionable insights to reduce methane emissions effectively. Read more here.

Mapping Where Tree Planting is Most Effective
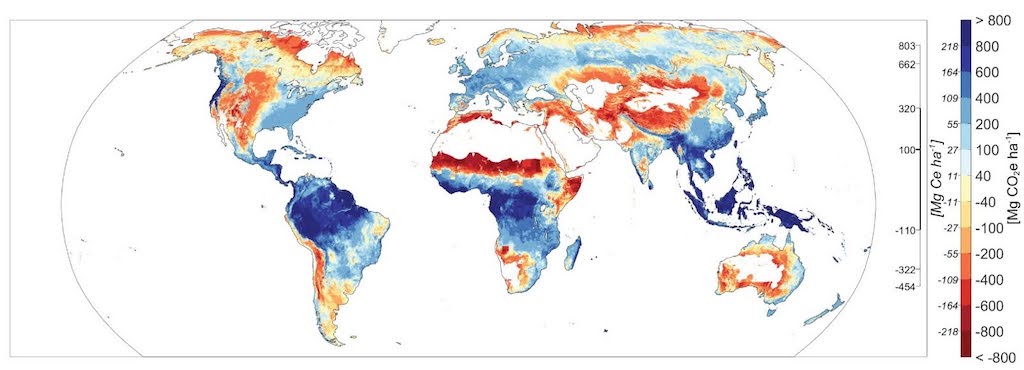
A new study published in Nature Communications explores the impact of albedo, the reflection of solar radiation from Earth’s surface, on tree-planting initiatives for climate mitigation. While restoring tree cover is recognized as a strategy to combat climate change, the study reveals that the effect of albedo can significantly alter the climate benefits of such projects. By mapping albedo changes resulting from transitioning various land covers to forests, the study shows that carbon-only estimates of climate benefits may overestimate the effectiveness of tree-planting efforts by 20-81%. The study’s findings highlight regions where tree planting could lead to net warming instead of cooling, emphasizing the need for careful consideration of albedo effects in climate mitigation strategies. The study also underscores the importance of location-specific assessments and the development of tools to guide nature-based climate solutions effectively. Read more here.
Missing BC Groundwater
Water management in British Columbia is facing scrutiny as experts express concerns about the province’s ability to track and manage groundwater usage, especially amid worsening drought conditions. Of not is a lack of comprehensive data on groundwater usage, with many license holders not reporting their usage to authorities. Additionally, mapping and monitoring infrastructure for groundwater sources are inadequate, leaving officials with an incomplete understanding of water usage patterns. B.C.’s government acknowledges the need for better data and monitoring, but progress has been slow, leading to challenges during times of water scarcity. Community-based initiatives are working to fill the gaps in data and promote water literacy, but funding cuts have hindered their efforts. Experts emphasize the importance of proactive investment in water management to avoid crises and maintain public trust. Read more here.
Mapping the Health Effects of Climate Change in Alberta
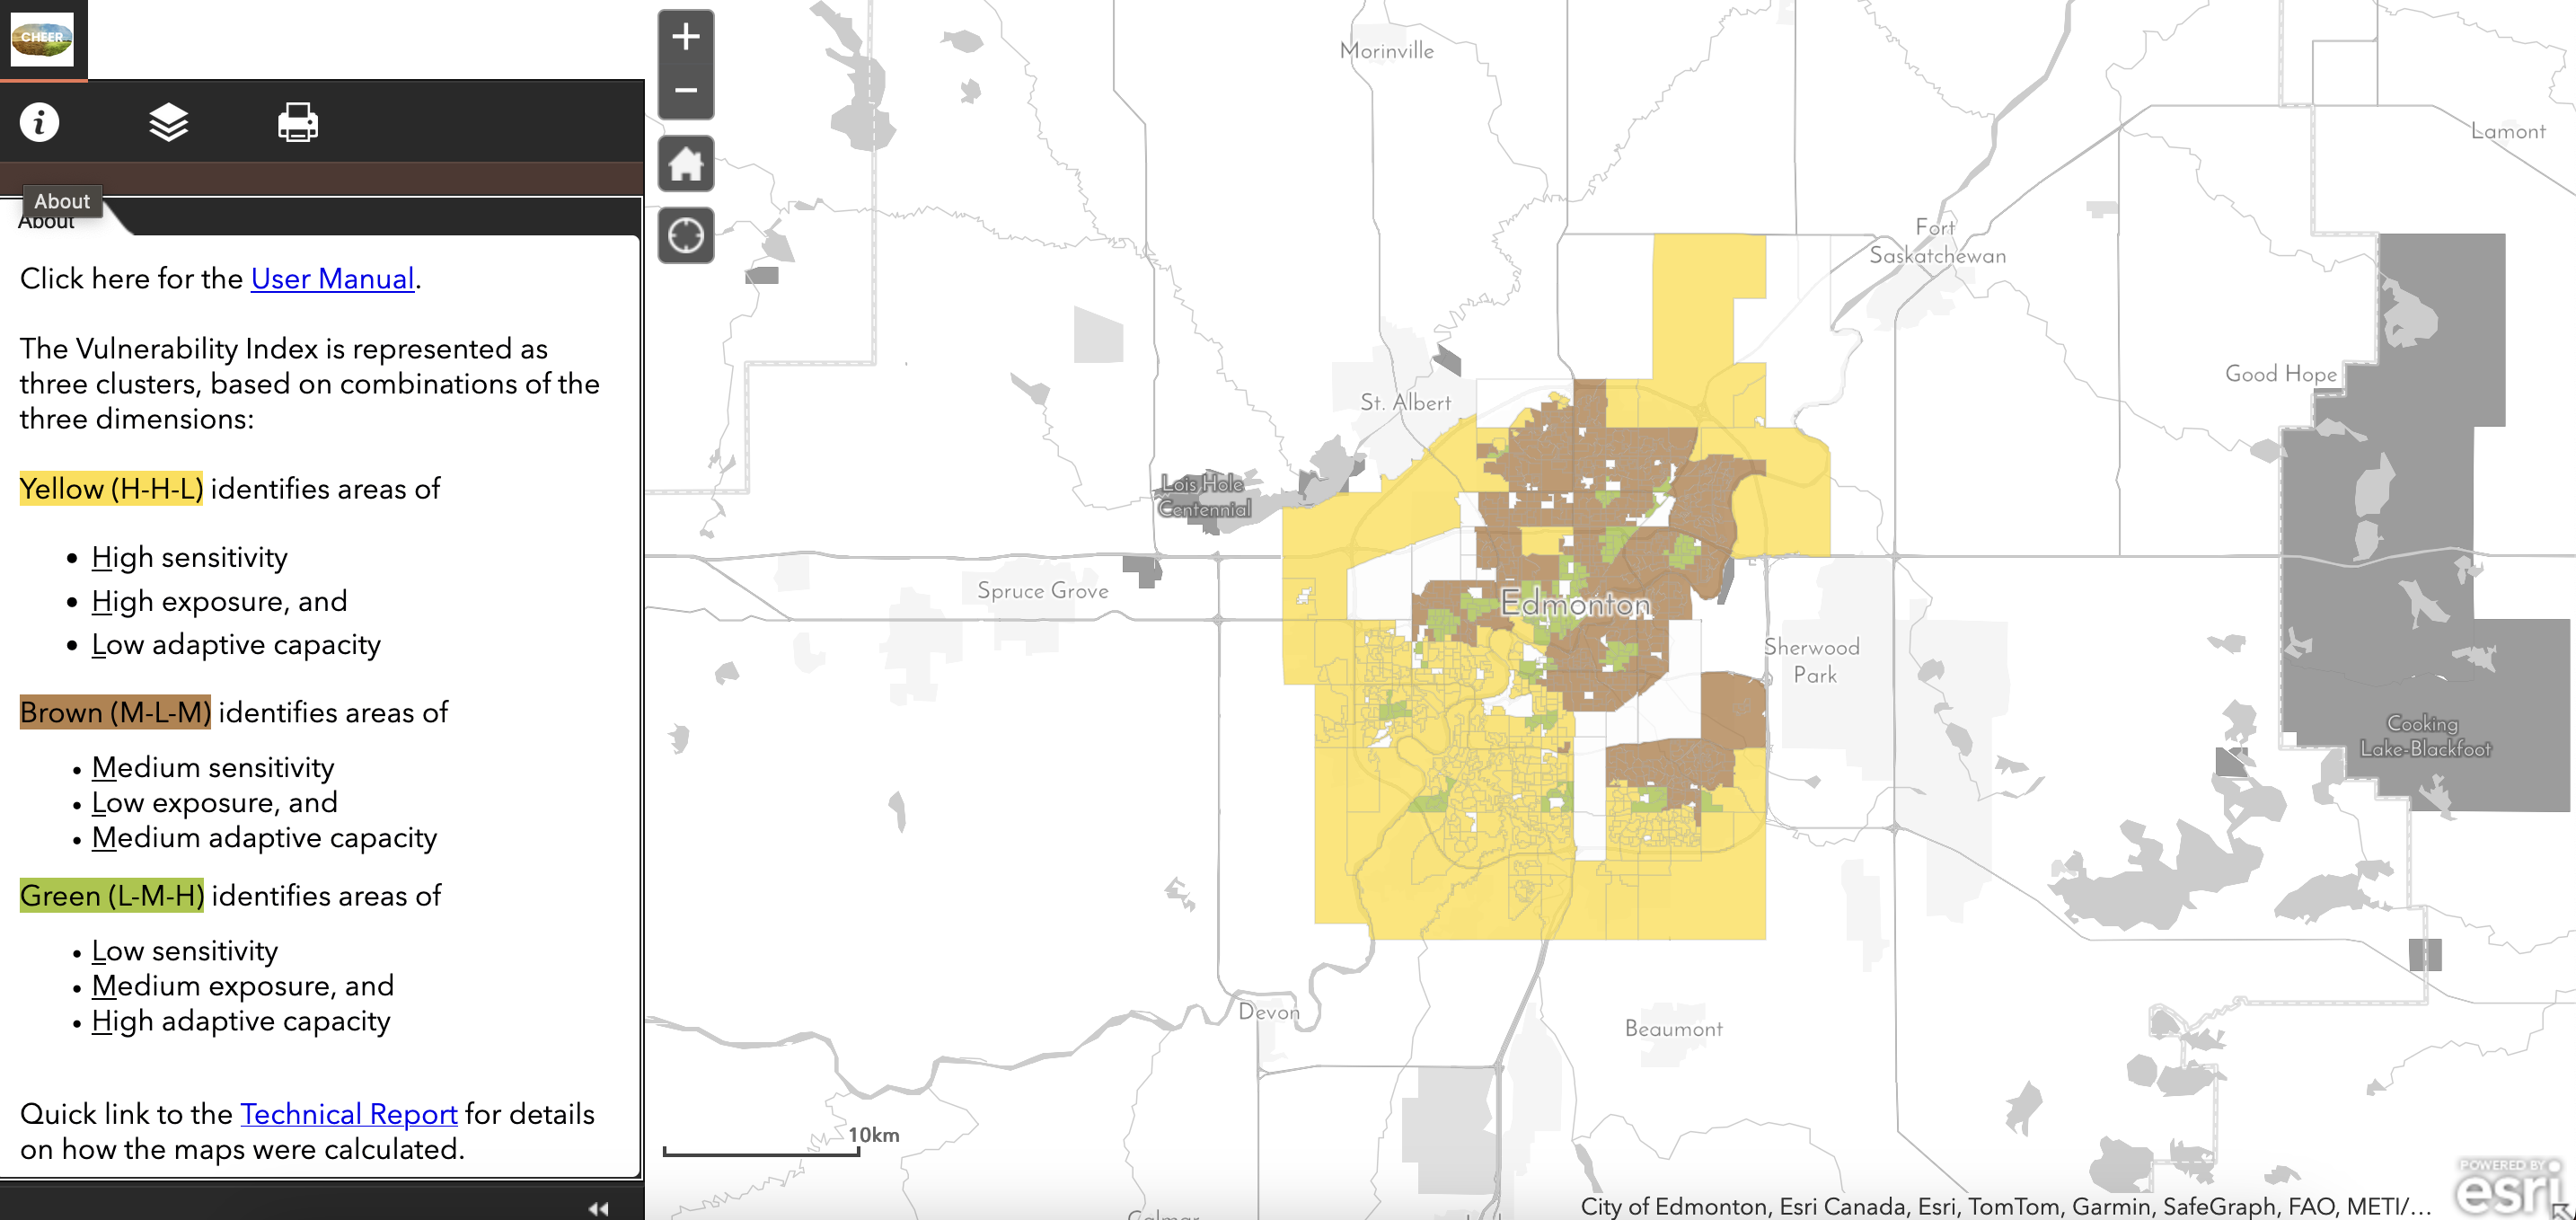
A research team at the University of Alberta is developing maps to illustrate the health impacts of climate change across different regions. These conditions include respiratory illnesses, mental health issues, cardiovascular disease, and dementia, with factors such as socioeconomic status and age influencing susceptibility. The maps integrate data on exposure, sensitivity, and adaptive capacity to assess the overall health risks posed by climate change. The team has already created a pilot map of Edmonton, revealing variations in exposure to smog and air pollution across different parts of the city. The project will expand province-wide to help inform policy-making and community-level decisions aimed at mitigating the health impacts of climate change. The researchers emphasize the importance of taking actionable steps to address these health risks, leveraging available data from provincial and national sources to guide interventions and initiatives. Read more here.
An Earth Day Letter from Jack Dangermond
The first Earth Day in 1970 marked a turning point in environmental awareness, catalyzing significant progress over the past 55 years. However, while there have been notable achievements, such as cleaner cars, increased renewable energy, and population growth, there is still much more to be done to address environmental challenges. We’ve learned that our collective actions shape the future, and it’s crucial to act with intentionality to protect the planet. Digital maps have emerged as powerful tools for understanding environmental issues and designing solutions. As we commemorate Earth Day, we must reflect on our progress, recognize the urgency of the present moment, and continue striving for a sustainable future. Read the letter here.
Bonus Map: Climate Issues Worldwide
February of 2024 was the planet’s hottest on record, continuing a trend of record-breaking temperatures for the ninth consecutive month. A new map from the National Oceanic and Atmospheric Administration highlights various climate anomalies worldwide, illustrating the extreme impacts of the unprecedented warmth. These anomalies include record-low sea ice levels in Antarctica, unusually warm winters in the Northern Hemisphere leading to historic lows in Great Lakes ice cover, and water-related disasters such as heavy rainfall and flooding in Ecuador and Madagascar, alongside drought conditions in parts of southern Africa. See the map here.




Be the first to comment