This is a fascinating question. However, none of us have ever empirically addressed this query. What is it that decides its remoteness? Well, there are various elements that determine how and why a specific place is remote or urban.
In the times when we don’t move around without carrying maps and technology, how informative would it be if these remote communities were mapped to their location and displayed in the form of an interactive, colourful map? Definitely, that will be so much easier than drawing it pictorially in our heads. right?
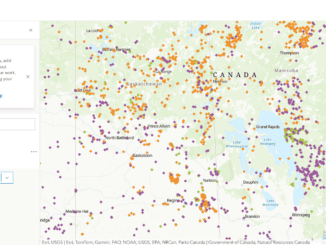
Below is a short clip of the map that displays the most recent list of remote and urban communities around Canada according to their remoteness.
Communities in darker and lighter shades of red are present. The darker the color, the more urban the community is. In contrast, the lighter the shade, the more remote the community is. You can explore this map and its features.
Index of Remoteness
It’s interesting to think about how remote the areas where we live are. It not only considers the current population data of that place but also the travel cost to the nearest population center via road network/ferry network or by air. In mathematical terms, the equation below is the formula and conditions that define the remoteness level and ultimately will give you the agglomeration level.
ALi=∑k=1n(PopkCi,k)
Popk/Ci,k= 0 for all Ci,k>$36.00 (150 minutes); and
Ci,k= Ci, closest if there is no PopCtr with Ci,k<= $36.00 (150 minutes) and i is connected to the main road network; and
Ci,k=$3 if i = k or if Ci,k< $3 (12.5 minutes).
If you want to go simpler than this, just take the total population of a community, and divide it by its travel cost to the nearest population center using a vehicle/ferry/air using current prices of gas for just one way trip in a mid-sized vehicle. That will give you the index of remoteness between 0 and 1. That is comparatively easier.
Who is on the top and bottom of the list of remoteness
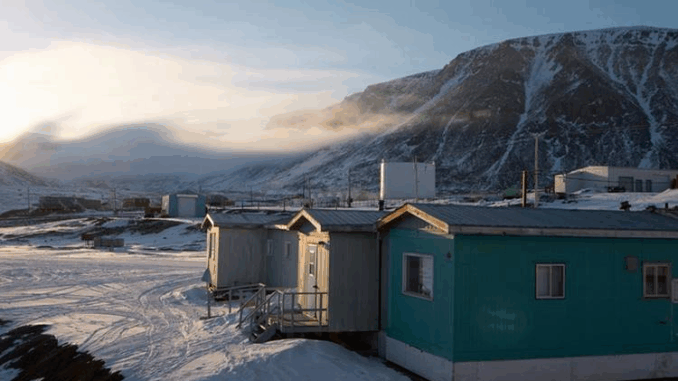
Grise Fiord has top the list with a remote index of 1.00. According to the census 2021, Grise Fiord has a population of 144. They live in 58 of its 64 total private dwellings, a change of 11.6% from its 2016 population of 129.

In the Qikiqtaaluk Region of Nunavut, Canada, on the southernmost point of Ellesmere Island, is the Inuit community of Grise Fiord. It is one of the island’s three settlements, and although having a small population, it is the largest community there. They rely on a once-a-year big shipment that brings a year’s worth of supply of building materials, snowmobiles, and non-perishable items.
In contrast, Toronto, which has a population of 2,794,356, has landed at the bottom of the list with a remote index of 0.00, making it the most urban city in Canada. It will need separate maps to show the medical facility and infrastructure. The city was and is the major destination for immigrants to Canada for decades. It is one of the most multicultural and multiracial cities in the world.

Transportation
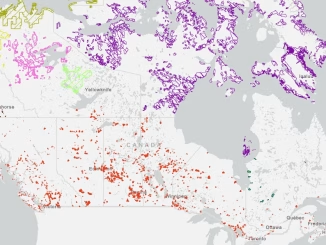
After carrying out further analysis with transportation data, I came up with this colorful representation of places with various modes of accessibility. Categorizing the transportation facility to remote places, pink indicates those places where you can only fly, whereas green indicates the combination of air, train, winter road, charter boats or seasonal ferry is possible. The black dot indicates, the place has no travel infrastructure yet.

Some communities in northern Canada can only be reached during the winter by plane or ice roads. However, the summer months bring some relief because boats can be used to improve accessibility.
Every year, travel in the Arctic region is more difficult due to climate change causing instability in road conditions. In terms of transportation infrastructure, northern and southern Canada has a significant gap. Northern Canada has received inadequate funding for infrastructure for several decades. Permafrost thawing due to extreme climate change may make transportation more difficult in these areas in the upcoming years.
Few points on geographic approach for remote locations
- Approaching infrastructure with GIS can provide a comprehensive and precise picture of the loopholes in the current design as well as allow us to rethink and rebuild a robust model, keeping in mind the changing priorities of communities and the potential climate change threat in the upcoming years.
- Is current infrastructure adaptable to the changing climate conditions in remote northern communities?
- Remote sensing and mapping rural areas can help us learn more about the communities, their needs, and their economic growth.
- Data-driven GIS can help study the demographics and socioeconomic data to find out the gaps in services and which communities are most affected. Consequently, more equitable economic possibilities will result.
- With accurate maps, rural/remote communities can be better educated and kept updated with road conditions, availability of supplies, medical facilities, and economic growth.
References:-
Williams,O. Jan 05, 2023. Cabin Radio. “Here are Canada’s most remote communities. Do you agree?”. Taken from: https://cabinradio.ca/113701/news/here-are-canadas-most-remote-communities-do-you-agree/
Blake.E. Nov 17th, 2022. CBC News.” Limited transportation facing threats in the north”. Taken from : https://www.cbc.ca/news/canada/north/northern-infrastructure-climate-1.6654833
Statistics Canada. Updated Jan 4th, 2023. “Index of Remoteness”. Taken from: https://www150.statcan.gc.ca/n1/pub/17-26-0001/172600012020001-eng.htm
StatisticsCanada. “Index of Remoteness 2021”. Update with 2021 census geographies and populations. Taken from: https://www150.statcan.gc.ca/n1/pub/17-26-0001/2020001/meta-doc-eng.htm#n5-refa


Be the first to comment