Remotely sensed data has been providing insights into how the world works for decades now. From the first implementation of aerial photographs to the advances of WWII that lead to the development of sonar and radar. While these early inventions had their uses, and in many cases still do, remote sensing has come a long way since then.
From the 1960s onward, we have had remote sensing instruments that have operated across the entire electromagnetic spectrum. Still, in recent years as technology has improved, optical imagery has taken the spotlight. As resolutions have increased, we have seen some incredible images such as the real-time eruption of a volcano and timelapses of planetary changes. As technology continues to progress and improve we will undoubtedly gain more incredible insight into the systems and operations of our planet. One newer technology that is making waves in remote sensing is hyperspectral imagery.
Multispectral vs Hyperspectral
Historically, multispectral imagery consisting of 3-15 bands has been the backbone of optical imagery. Measuring bands whose wavelengths typically span 60-80 nm, this imagery is great for assessing vegetation, water, man-made objects and more. By contrasting bands in the blue, green, red, or near-infrared (NIR), we can create informative products for a wide variety of audiences. However, hyperspectral imagery takes these capabilities even further.

The Basis for Spectral Analysis
When astronomers look to the skies in search of other life, spectral signatures provide them with key insights into the makeup of the stars and their orbiting planets. The foundation of modern spectroscopy comes from G.R. Kirchhoff and R. Bunsen, who, building on the work of Sir Isaac Newton demonstrated that different chemical elements have unique but constant wavelength signatures, which can be interpreted to identify elemental makeups of planetary bodies in far away star systems.
This incredible discovery continues to benefit us closer to home today as we realize that these principles can also be applied to the spectral signatures emitted by minerals. By observing the “solar radiation that a mineral reflects, transmits, and emits” spectral signatures can be identified and catalogued for more than 4000 naturally occurring minerals found on earth. In mineral exploration, geochemical composition analysis provides insights into the environments that created these geologic formations.

Applications in Geology
Indicator minerals provide a geochemical indication of the presence of sought-after ore bodies. For example, the presence of elements such as copper, lead, and cobalt can be geochemical indicators of the presence of gold. This can be beneficial as spectral analysis indicating the presence of minerals rich in these elements could be a key indicator that gold is present in the area. This is especially useful in areas like the Canadian Arctic, with plentiful exposed outcrops. This would help to greatly narrow down the search area for an exploration company hoping to find gold-rich formations without the expensive costs of field excursions and exploratory drilling.
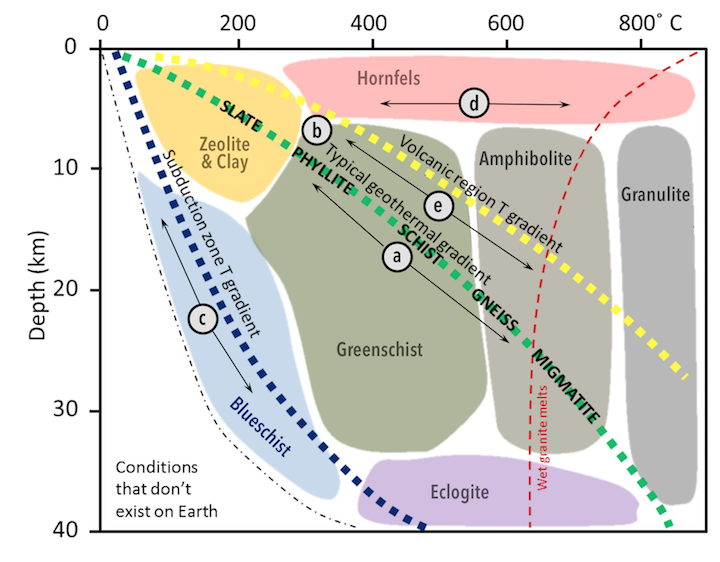
Index minerals are minerals that require specific ranges of pressure and temperature for their formation, creating various levels of metamorphism in the rocks in question. By assessing which index mineral is present in a rock formation, you can understand the minimum level to which the formation has been metamorphosed. This is an indicator of the environment and conditions which formations have undergone, especially when looking for economically valuable minerals that require minimum pressure and temperature conditions to have formed. By using hyperspectral image analysis to identify the presence of index minerals, a map can quickly be generated that indicates the metamorphic conditions present in vast areas, narrowing down regions of interest.
Looking to the Future
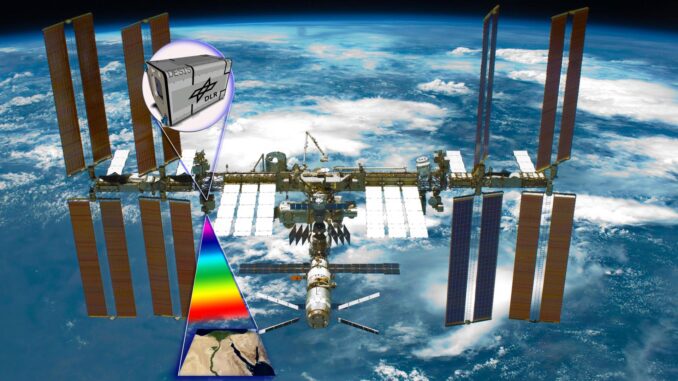
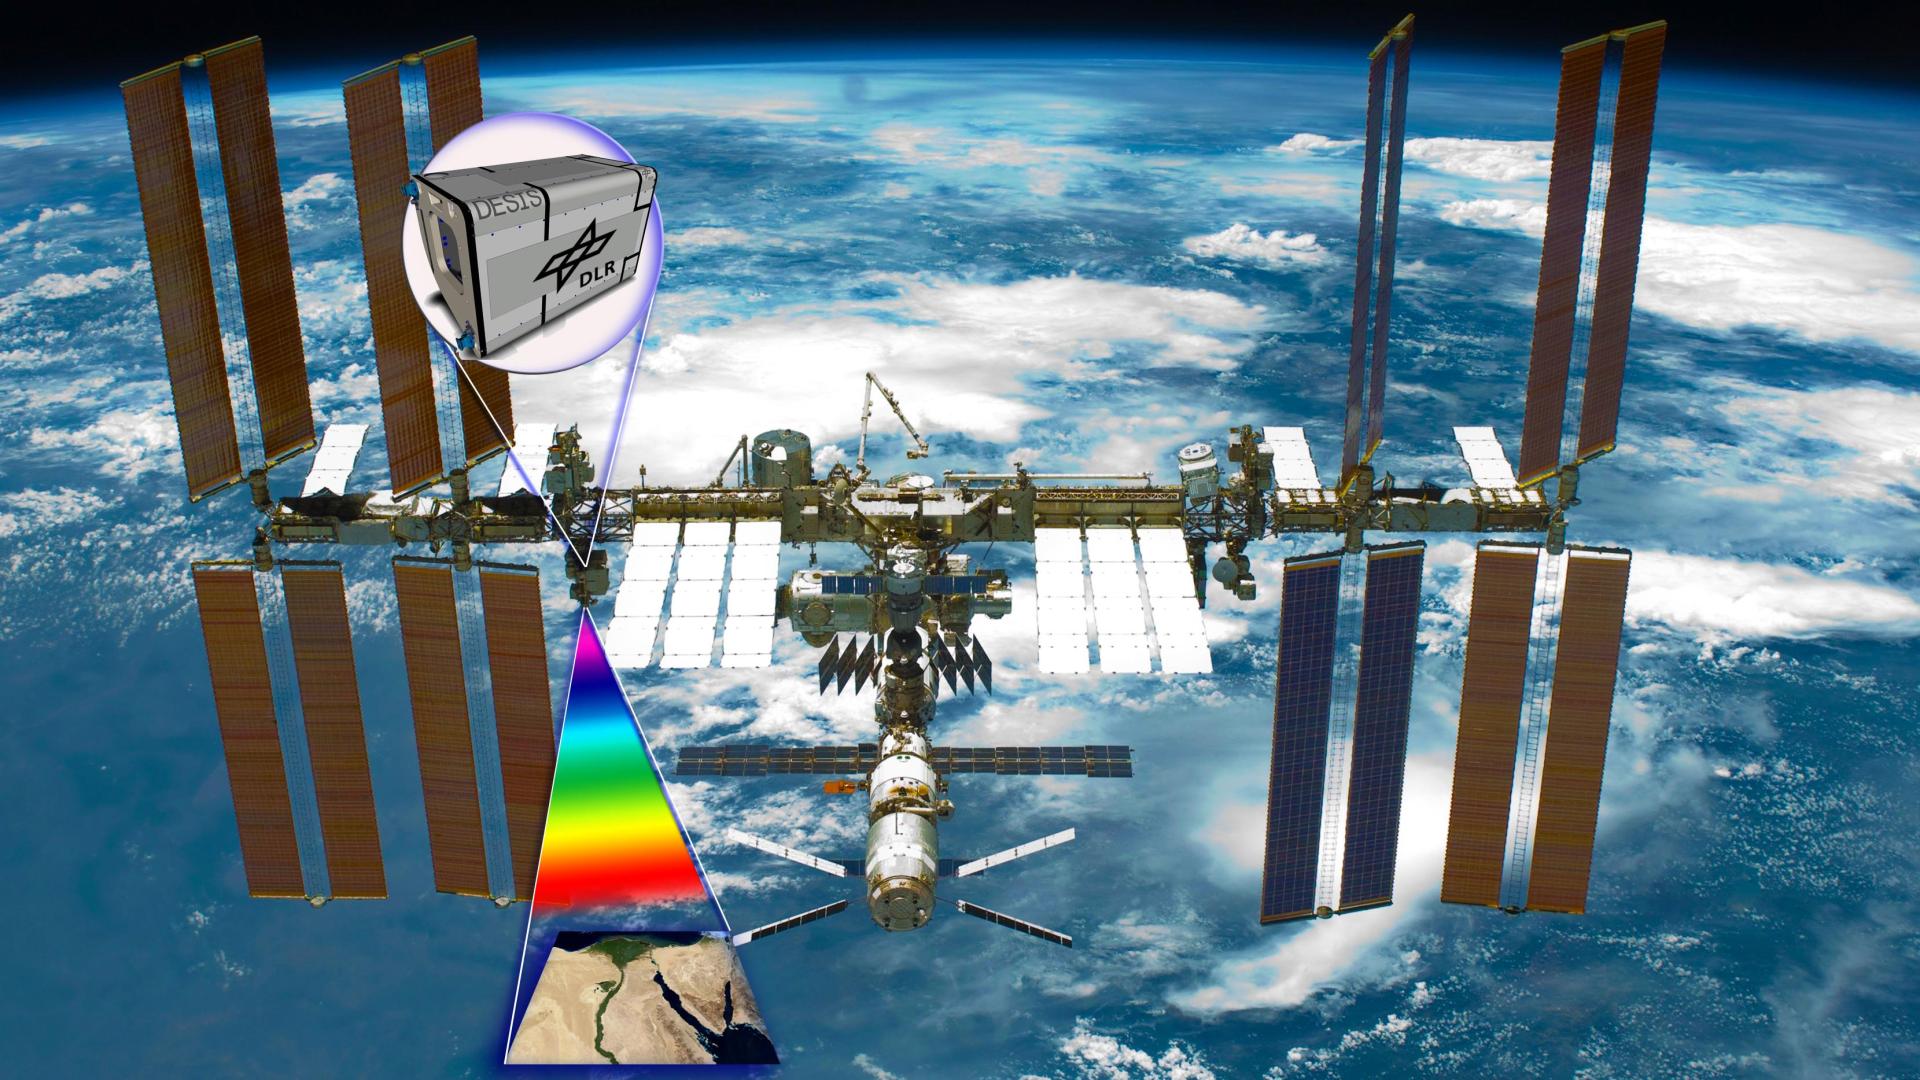
While approaches will vary based on commodity and environment, the use of hyperspectral imagery for exploration is showing great promise in its infancy. With at least 6 hyperspectral missions already underway, including a cutting-edge hyperspectral lab for the International Space Station, we are bound to see incredible growth in the hyperspectral field. Thanks to its incredible ability to differentiate and isolate narrow wavelength bands for spectral signature identification, we can rest assured that this is just the beginning of creative and game-changing applications of hyperspectral remote sensing products.
Resources
[1] https://www.esri.com/about/newsroom/arcwatch/mineral-exploration-in-the-hyperspectral-zone/
[2] http://www.csr.utexas.edu/projects/rs/hrs/hyper.html
[3] https://www.nrcan.gc.ca/sites/www.nrcan.gc.ca/files/earth-sciences/files/pdf/geomatics/11-0437-Hyperspectral-data_eng.pdf
[4] GERALD K. MOORE (1979) What is a picture worth? A history of remote sensing / Quelle est la valeur d’une image? Un tour d’horizon de télédétection, Hydrological Sciences Bulletin, 24:4, 477-485, DOI: 10.1080/02626667909491887
[5] https://www.accessscience.com/content/a-brief-history-of-spectroscopy/BR0213171
[6] https://www.thoughtco.com/what-are-index-minerals-1440840#:~:text=Geologists%20look%20at%20the%20minerals,much%20the%20rock%20has%20metamorphosed
[7] https://investingnews.com/daily/resource-investing/precious-metals-investing/gold-investing/indicator-minerals-pathfinder-minerals-and-gold-exploration/
[8] https://www.eoportal.org/satellite-missions?Instrument+Types=Hyperspectral+imagers
[9] https://www.imveurope.com/news/hyperspectral-remote-sensing-be-added-iss-lab
[10] https://www.dlr.de/content/en/articles/news/2018/2/20180629_hyperspectral-earth-observation-instrument-desis-sets-off-for-the-iss_28665.html
[11] https://openpress.usask.ca/physicalgeology/chapter/10-4-metamorphic-facies-and-index-minerals-2/
[12] https://www.flickr.com/photos/bob_81667/8190833311
[13] https://www.nireos.com/hyperspectral-imaging/


Be the first to comment