The Breaking News
Last year, the International Consortium of Investigative Journalists announced that a year prior, one of their members (Süddeutsche Zeitung) had been sent the contents of a massive leak from the Panamanian law firm Mossack Fonseca.
This leak revealed that for years the firm had been helping people and companies all around the world avoid taxes by channeling wealth through overseas shell companies, most notably in the British Virgin Islands and Bahamas. The clients came from over 100 countries, including Canada. CBC and the Toronto Star are the two Canadian members of the ICIJ and both produced some stories in the ensuing months of some of the Canadians whose names appeared in the links.
These stories revealed how the clients became wealthy and tried to answer why they went to Mossack Fonseca to hide their money. Some stories also covered the broader issues of tax evasion in Canada. One Star article quoted an estimate of $6 billion to $7.8 billion a year as the annual amount the country’s coffers lose to offshore tax evasion. Once cannot help but think of what this money could do for our country. Surely, the lost money could help our healthcare system or fill a few potholes in our roads. I began to think more about where this money is lost from. The stories named a few people who had showed up in the leaks, but they were just a small amount of a long list.
When the ICIJ announced their Panama Papers project, they made a web site with a database, containing contact information for all accounts. This database could be a massive favour for national tax and revenue agencies all over the world; and it could also be a favour for curious minds. After searching for the city I was living in, I found an inconspicuous address. Located above a business and copy shop, a small apartment was apparently the mailing address of a Mossack Fonseca client. I passed this apartment on my way to work every day, and it never struck me that it could be a link to an international tax haven.
A few months after the initial announcement, the ICIJ released downloadable data tables of all the accounts. A key column in one of these tables was the address listed for each account. Another column simply listed the country associated with the client. This column made it easy to narrow down the list to only Canadian clients. Looking at a list that included nearly 1300 Canadian addresses, I began again to wonder where these people, or companies, were.
A Geographical Approach
I was less interested in the individual stories each account had and more curious about the accounts as a whole. If I had ever thought about offshore bank account holders in Canada, I imagined them clustered in Bay Street offices or Westmount mansions. I wanted to know if this was the case, or if the accounts tended to point towards more modest homes like the one along my commute.
To quell my curiosity, I did what any GIS graduate would do: map the accounts myself. After isolating the Canadian accounts, I had to go through each address in the catalogue, making new columns for the specifics (street name, city, etc.) so the accounts could be geocoded. Once the accounts had a spatial reference, analyses could be made.
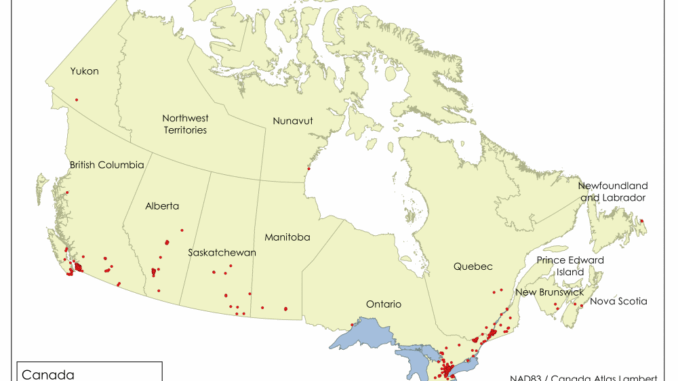
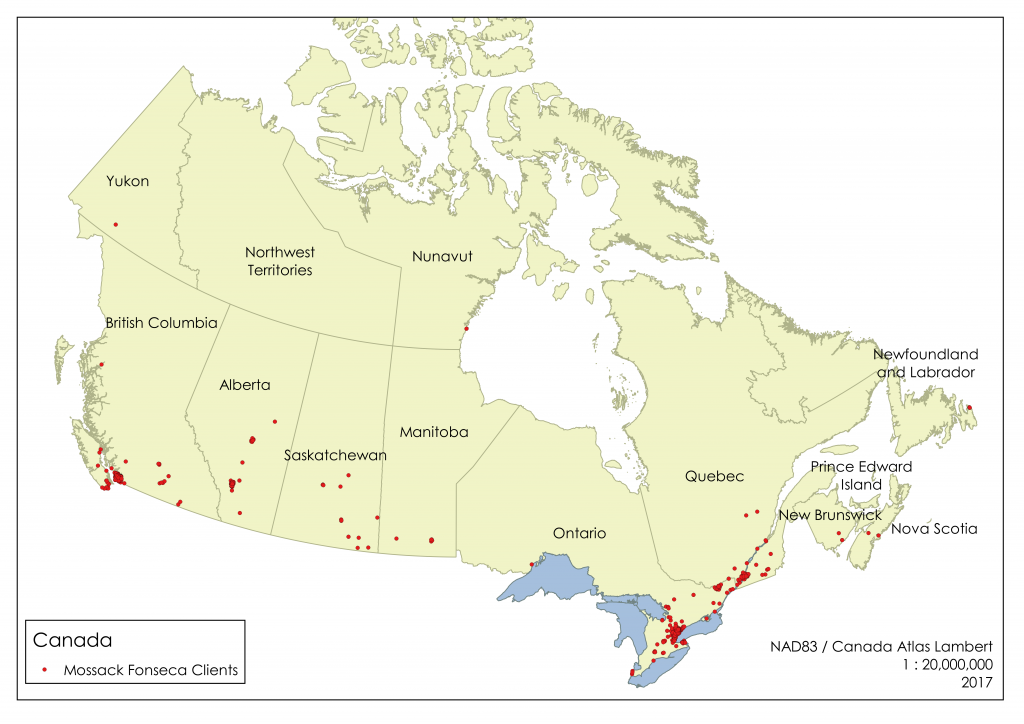
The addresses linked to the accounts appear all over Canada. One province (Prince Edward Island) and one territory (Northwest Territories) were not represented. Every other administrative division made an appearance at least once. Many accounts are addressed to post office boxes. Some lead to modest suburban homes or small towns.
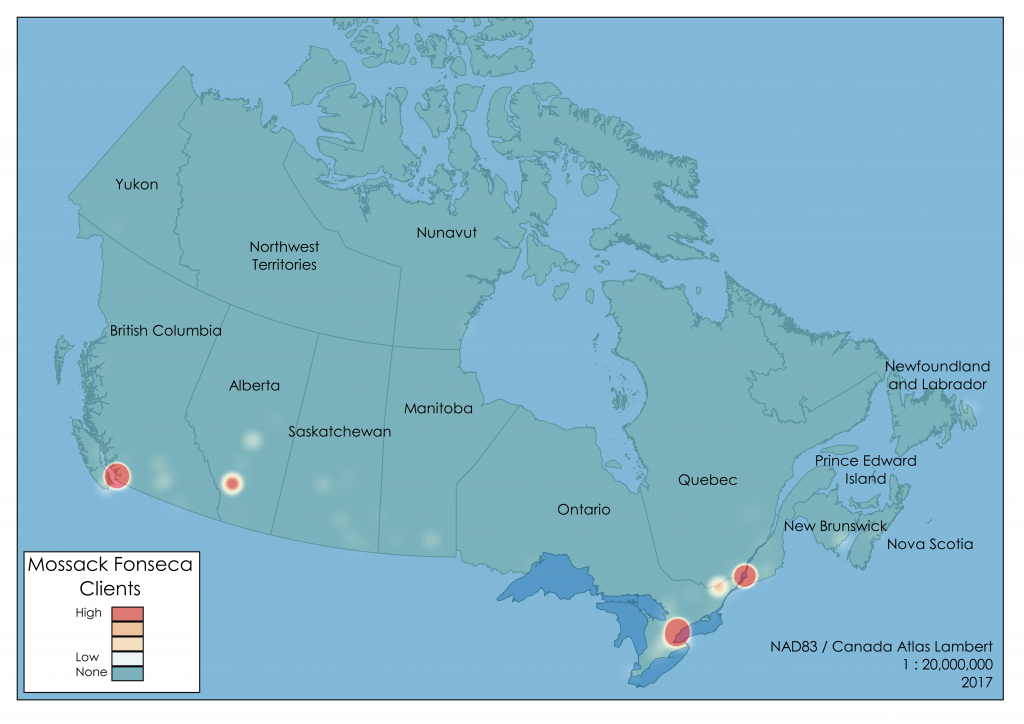
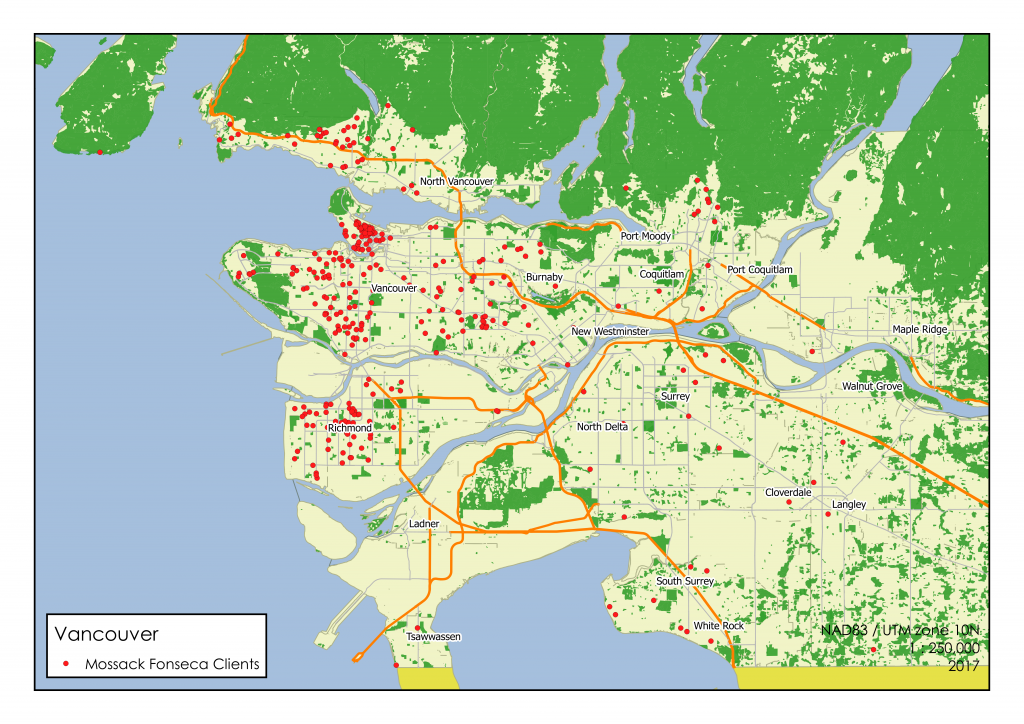
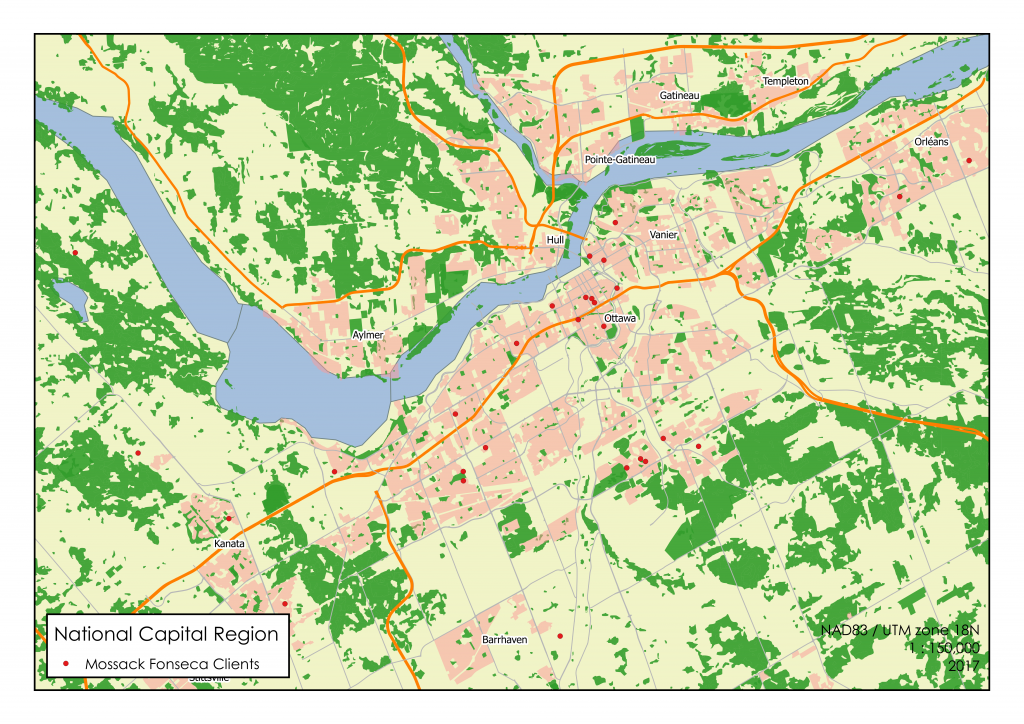
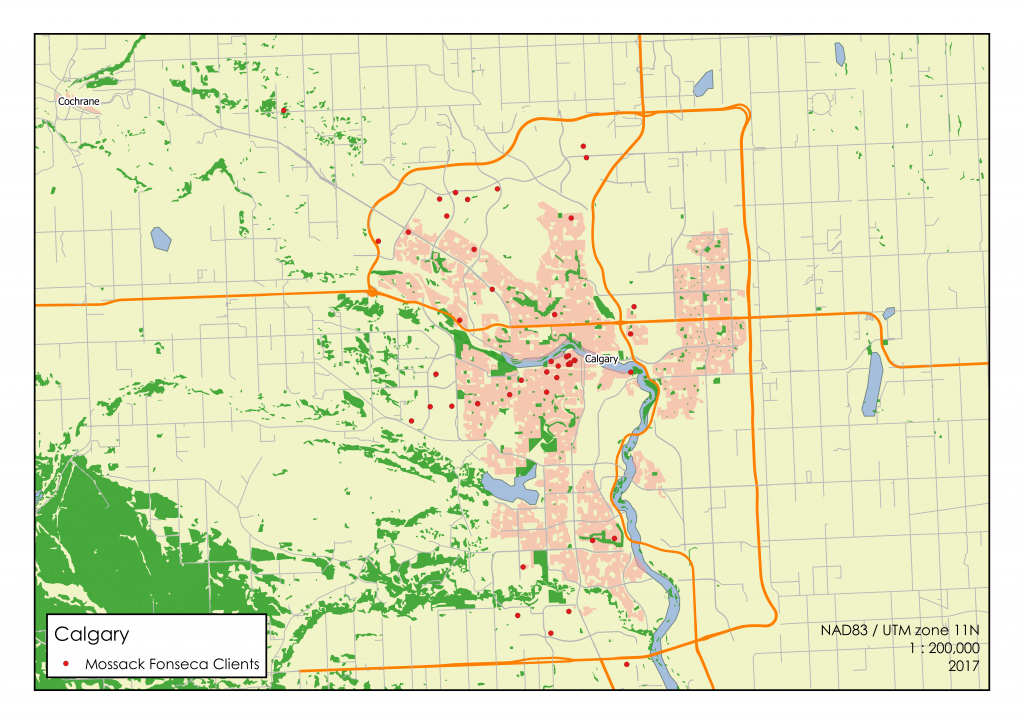
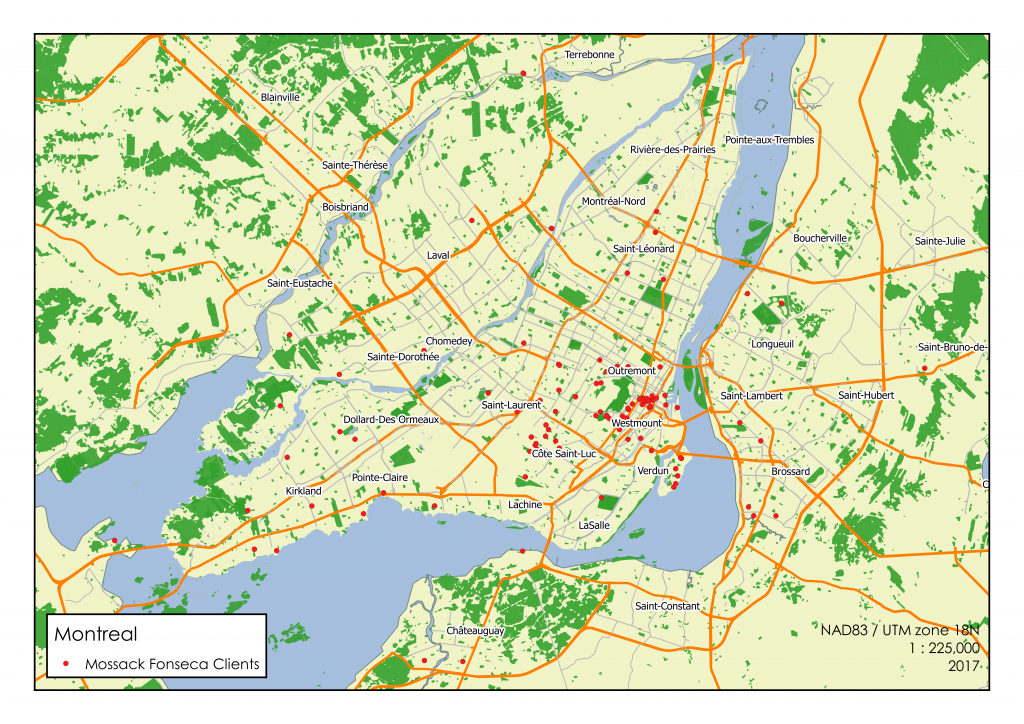
However, most accounts lead to where one might expect. More than three quarters of the accounts area addressed to Toronto, Montreal and Vancouver. For all cities, I used the Census Metropolitan Areas, as defined by Statistics Canada. This means that suburbs like Mississauga, Laval and Richmond do not count as separate cities. Table 1 shows the ten most represented cities. The fourth column shows the people per client, based on each CMA’s population according to the 2016 census.
Table 1
| CMA | Population (2016) | MF Businesses | People Per Businesses |
| Toronto | 5,928,040 | 439 | 13,504 |
| Vancouver | 2,463,431 | 395 | 6,237 |
| Montréal | 4,098,927 | 180 | 22,772 |
| Calgary | 1,392,609 | 59 | 23,604 |
| Ottawa – Gatineau | 1,323,783 | 37 | 35,778 |
| St. Catharines – Niagara | 406,074 | 14 | 29,005 |
| Hamilton | 747,545 | 12 | 62,295 |
| Edmonton | 1,321,426 | 11 | 120,130 |
| Saint John | 126,202 | 7 | 18,029 |
| Kitchener – Cambridge – Waterloo | 523,894 | 7 | 74,842 |
Mossack Fonseca Across Canada
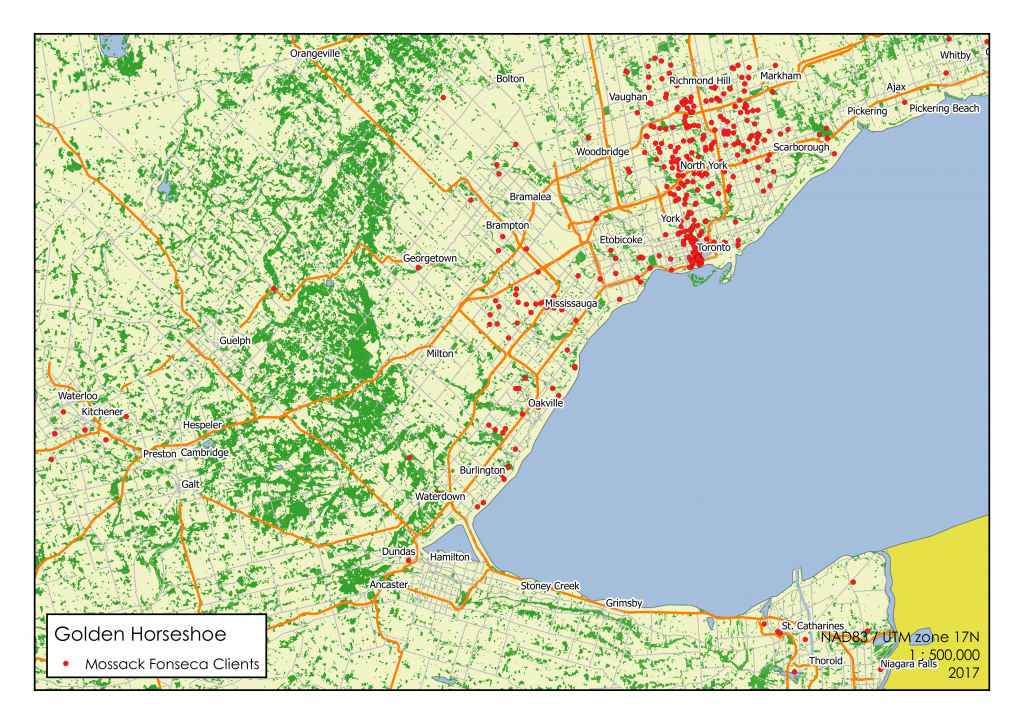
Looking at the higher scale maps, many businesses are addressed in the various central business districts and nearby affluent residential areas. There is not a high-scale map for each location as we might not learn much from a single red dot in the middle of a rural area. I made a map through My Maps where you can navigate through different parts of Canada and see the locations. Using the IDs, you can find out more about these businesses through the ICIJ web site.
Each account represents a business, not a person. Some addresses appear multiple times indicating there are two, five or even ten businesses located out of a single address. When looking at the amount of accounts in relation to the number of registered businesses (Table 2), the results are reflective of Table 1.
With small sample sizes, Yukon and Nunavut can be left out. Among the rest, British Columbia by far has the highest rate of Mossack Fonseca clients with 417 registered businesses for every Mossack Fonseca client. The rate across Canada is 1,189 registered businesses for each client. Table 3 summarizes the share of clients each province and territory has.
Table 2
| Total Businesses | MF Businesses | MF Rate | |
| AB | 169,305 | 76 | 2,228 |
| BC | 178,966 | 429 | 417 |
| MB | 38,712 | 6 | 6,452 |
| NL | 17,526 | 4 | 4,382 |
| NB | 25,509 | 8 | 3,189 |
| NS | 29,922 | 3 | 9,974 |
| NU | 736 | 2 | 368 |
| NWT | 1,658 | 0 | N/A |
| ON | 416,801 | 551 | 756 |
| PEI | 5,935 | 0 | N/A |
| QC | 239,966 | 196 | 1,224 |
| SK | 41,185 | 15 | 2,746 |
| YK | 1,757 | 1 | 1,757 |
| Canada | 1,167,978 | 1291 | 905 |
Table 3
| Province | MF Businesses | Share of Canada’s MF Businesses |
| AB | 76 | 5.9% |
| BC | 428 | 33.2% |
| MB | 6 | 0.5% |
| NL | 4 | 0.3% |
| NB | 8 | 0.6% |
| NS | 3 | 0.2% |
| NU | 2 | 0.2% |
| NWT | 0 | 0.0% |
| ON | 550 | 42.7% |
| PEI | 0 | 0.0% |
| QC | 196 | 15.2% |
| SK | 15 | 1.2% |
| YK | 1 | 0.1% |
| Canada | 1289 | 100.0% |
What Now?
The ICIJ has done a fantastic job in making the leaked data accessible and simple to navigate. This list does not show every single tax cheat in Canada. There have been other illegal tax schemes uncovered and there are quite possibly more that remain hidden. Some argue that these clients are not even tax cheats because they have merely exploited a legal loop hole.
We do, however have a large enough sample size to see where the centres are for a very popular method of tax evasion. Experts looking at the spatial data may be able to determine if these hot spots are symptomatic of tax evasion culture or a major cause of it. My hope is that Canada Revenue Agency can recoup lost tax dollars whilst discouraging similar behaviour in the future. Success in this endeavour would mean financially strengthened services and institutions in Canada.



Be the first to comment