
The current pandemic is highlighting how important GIS is in understanding and interpreting data. History shows the evolution of GIS for mapping disease and the unique ways in which it can be used.
Cholera, 1854
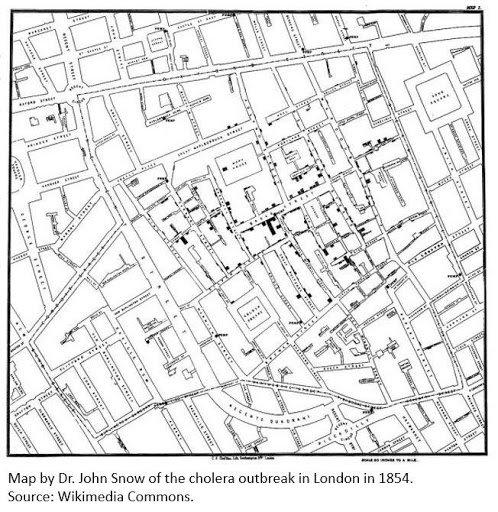
In 1854, Dr. John Snow, a British physician known as the father of epidemiology, wanted to discover the origin of the cholera outbreak in London. It was thought that during this time cholera was transmitted by the miasma theory of disease which suggested that diseases were spread through bad air. Up until that time, germ theory had not yet been discovered. Dr. Snow had previously hypothesized that there may be contamination of the water supply. He wanted to test this theory, so he sought to amalgamate key features and display them spatially to uncover any correlation between the location of illness and the water supply. Dr. Snow drew a map of the area which included roads, a few businesses, deaths from cholera and water pumps. Upon spatial analysis of the region, Dr. Snow recognized that his theory may have been correct as many of the deaths from cholera were clustered around one of the neighbourhoods’ water pumps. Through Dr. Snow’s analysis, it recommended having the pump handle removed which led to a sharp decline in deaths.
The collection of data combined with spatial mapping techniques by Dr. Snow was one of the first known uses of GIS to map a disease. This discovery paved the way for disease diffusion mapping, suggesting that disease spreads from a central source, and this theory will be used in the future for disease detection and mitigation linking geography to public health to better understand the spatial transmission of disease.
Spanish Flu Pandemic, 1918
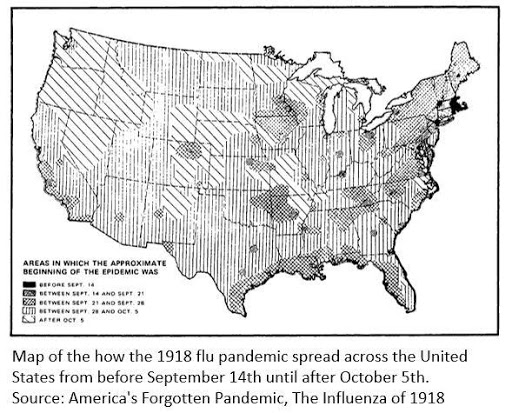
There is still much debate about the origin of the Spanish Flu, however, cartography was used to perform spatial-temporal analysis of the spread of the virus throughout the United States. The map demonstrates how the Spanish flu moved across the United States by showing route and duration. The pandemic was thought to have first made an appearance in the region between Massachusetts and Virginia, and from there the virus spread to many cities by railway and river channels. Interestingly, the data shows that the virus travelled along the same path as the pioneers. It had easily moved through the shortest passages and was able to eventually trickle into every region of the country.
Most Recent Ebola Virus Outbreak, 2013-2016
After the worldwide web became public in the 1990s, spatial analysis became much more sophisticated and efficient. During this time, GIS technology became widely used in classrooms and by businesses and governments. Open source GIS emerged allowing for free and readily available access to the public. Scientists utilized open source GIS applications while conducting research on the most recent Ebola epidemic in Western Africa. The Red Cross called on volunteers to assist in creating detailed maps of remote regions of Western Africa to better respond to the Ebola epidemic. Mapping remote areas was an essential task for identifying and understanding the spread of this disease.
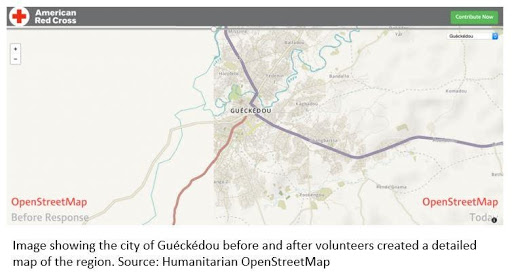
There are many ongoing Humanitarian OpenStreetMap projects in need of volunteers. Visit: https://www.hotosm.org/
SARS-CoV-2, 2019-Present
Today, the coronavirus pandemic may be the most mapped disease in history. Technological advancements have allowed the creation of dynamic maps that display up-to-date information about the pandemic that is accessible to anyone who has access to the internet. Many thematic maps have been used to display different aspects of the pandemic; choropleth maps have been used to display severity in case of counts across regions, dot-density maps show clusters of cases, proportional symbol maps show coronavirus hotspots and animated time series maps have been used to show the spread of the disease. Many other aspects of the pandemic have also been mapped, such as vulnerability, unemployment, available resources, and vaccine distribution.
Dashboards were created to track the spread of COVID-19 cases locally and globally.
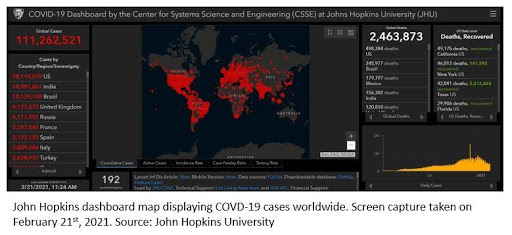
John Hopkin’s University Global Dashboard: https://coronavirus.jhu.edu/map.html
Government of Canada’s Dashboard which includes many provinces: https://resources-covid19canada.hub.arcgis.com/
Global map gallery comprised of many dashboards that track different variables around the world: https://www.esri.com/en-us/covid-19/community-maps/gallery#/
Animated time series map of the global spread of COVD-19: https://healthmap.org/covid-19/
These maps are a source of reliable information that are kept up to date. We have come a long way with GIS mapping technologies and the importance of these applications have proven to be an integral part in tracking, monitoring, and understanding disease.
References
Bynum, W. F. (2013). In Retrospect On the Mode of Communication of Cholera. Nature. Retrieved 2021, from https://www.nature.com/articles/495169a.pdf?origin=ppub
Crosby, A. W. (2003). America’s Forgotten Pandemic, The Influenza of 1918. Cambridge, UK: University of Cambridge.
O’Hara, M. (2014). Hewlett foundation Grant Summary: Ebola Epidemic Response. Retrieved February 20, 2021, from https://www.hotosm.org/updates/2015-11-19_hewlett_foundation_grant_summary_%7C_ebola_epidemic_response_
Steenson, R. (2019). The history of geographic information Systems (GIS). Retrieved February 20, 2021, from https://www.bcs.org/content-hub/the-history-of-geographic-information-systems-gis/


Be the first to comment