
A new class of artificial intelligence is changing how we understand the planet. Known as foundation models, these systems are trained on massive, planetary-scale datasets drawn from satellites, sensors, and geospatial platforms, allowing scientists and decision-makers to detect patterns and trends that were once invisible.
Powered by advances in deep learning and computing, AI is now being applied to some of the world’s most complex environmental challenges—from tracking ecosystem change to supporting climate and conservation decisions.
In Canada, this shift is taking shape through Planaura, a collection of geospatial foundation models developed by the Canada Centre for Mapping and Earth Observation at Natural Resources Canada. Built specifically for environmental and land-use applications, Planaura is designed to turn Earth observation data into practical insights for smarter, more informed decision-making.
What is Planaura?
Planaura, a collection of Canadian geospatial foundation models, has been trained on a decade of data (2015–2024) covering Canada’s vast and diverse landscapes. Most of the training data were collected during spring and summer, primarily from June through September.
There two version of Planaura that currently publicly accessible on GitHub and HuggingFace:
- Planaura_HLS is best suited to be used with HLS imagery at resolutions of 30 meters.
- Planaura_S2 is best suited to be used with S2 imagery at resolutions of 10-20 meters.
Although the Planaura_HLS model has demonstrated robust generalization across both Sentinel-2 (S2) and Harmonized Landsat and Sentinel-2 (HLS) data sources, the Planaura_S2 model was specifically fine-tuned using higher-resolution data.
The observations indicate that this specialized model exhibits marginally superior performance on 10-meter resolution imagery compared to Planaura_HLS and can detect more subtle changes when applied to change detection tasks.
Types of Input to the model
In bi-temporal mode (num_frames=2): Two satellite images of the same location taken at two different epochs.
In static mode (num_frames=1): One satellite image.
Source of imagery can be either Sentinel-2 imagery or Harmonized Landsat and Sentinel imagery.
Expected spectral bands of each image (in the order provided below):
- band 0: blue – B02
- band 1: green – B03
- band 2: red – B04
- band 3: near infrared with central wavelength of 865 nm – B8A
- band 4: short wave infrared with central wavelength of 1610 nm – B11
- band 5: short wave infrared with central wavelength of 2190 nm – B12
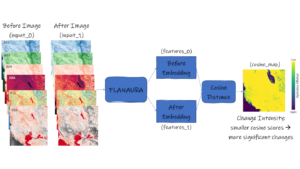
Planaura includes a two-epoch (bi-temporal) encoder that enables:
Embedding Images into Feature Maps
This process involves transforming each image into a feature map, which is structured into a numerical representation of the image. The goal is to capture features such as shapes, textures, and patterns to make information understandable. These feature maps can later be used for clustering and classification. In simple terms, it provides a detailed summary of the photo’s content that a machine can understand.
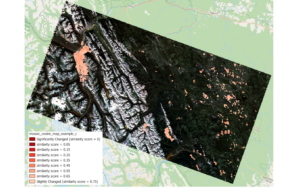
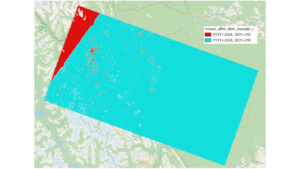
Calculating the intensity of changes between two images.
This is not merely a change in brightness between two images, but rather a more meaningful contextual change between two-time frames. Speaking of contextual change, I would like to mention a real-world example. For instance, a forest being replaced by farmland or an urban development along a riverbank. This approach enables AI models to detect significant environmental changes rather than noise or lighting differences.
As climate change intensifies, foundation models like Planaura have the potential to become transformative tools for Canada, enabling smarter, faster, and more effective environmental and ecosystem management at an unprecedented scale.
What it means to Canada?
Canada spans over 9.9 million square kilometers, encompassing six time zones and a wide array of physical landscapes. Its geographical diversity includes mountain ranges, plains, forests, lakes, rivers, and Arctic tundra.
This diversity is not only of academic interest but also critical for understanding patterns of urbanization, resource distribution, and environmental challenges. As climate change increasingly impacts northern regions and human activities continue to pressure ecosystems, studying Canadian geography offers valuable insights into national planning and global environmental issues (Henstra et al., 2019; Environment and Climate Change Canada, 2023).
Among the myriads of applications, a few to demonstrate how Planaura can be a game changer for Canada:
Wildfire monitoring
The intense wildfire season in Canada is becoming the norm. Planaura can analyze continuous streams of satellite imagery and environmental data to detect early indicators of wildfire activity, such as changes in vegetation health, soil moisture, land surface temperature, and atmospheric conditions. By learning normal landscape patterns across regions, the model can quickly flag anomalies that may signal heightened fire risk or active ignition.
Once a wildfire is underway, Planaura can support near-real-time fire mapping by rapidly classifying burned areas, tracking fire perimeters, and identifying hotspots using multispectral and thermal satellite data.
Large-scale Environmental Monitoring
Trained on 10 years of high-resolution Canadian geospatial data, covering diverse Canadian landscapes, Planaura can detect changes in forest, wetlands, rivers, and urban areas over time. For example, monitoring deforestation, wetland loss, or urban expansion in near real-time.
Ecosystem Health Assessment
Forest degradation, grassland shifts, or wetland shrinkage can be detected by extracting contextual ecological features from the imagery such as canopy density, or water coverage. This can be automated to cover larger landscape ecosystem mapping.
Biodiversity Monitoring
Biodiversity monitoring is another key application for detecting contextual changes. It allows us to track habitat alterations, fragmentation, the impacts of climate change, and the spread of invasive species
Supporting Decision-making and Conservation
- When environmental data is visual represented in the form of maps, dashboards, it enhances transparency and aligns stakeholders around data-driven strategies.
- Land use planning can run efficiently for sustainable development and minimal ecological disruption.
- Supports evidence-based decision-making for land-use policies and conservation zoning
Planaura can act as a decision-support engine for conservation by combining environmental data, AI analytics, and geospatial intelligence.
Planaura’s sample use cases
Enabling Smarter Conservation Decisions
Planaura demonstrates how integrated data and intelligent analysis can strengthen conservation outcomes. By improving situational awareness, reducing uncertainty, and supporting transparent decision-making, it helps align environmental protection with policy, planning, and sustainability goals. In an era of rapid environmental change, such decision-support systems are no longer optional—they are essential.


Be the first to comment