
Geographic information technology has been used to answer questions of locations. Where are the sewer lines? How close is the construction site to the streams? Which migration path does the American Robin take in the fall? Similarly, with GIS, perhaps we can find out why your midfielders are not supporting you in the Sunday league games.

Photo credit: AP image
Association football (soccer) is all about space. As modern soccer evolves, teams now focus more on the movement of the players as a team, and they pay extra attention to exploiting spaces to achieve their tactical objectives. Spatial technology is then heavily involved in match analysis in game preparations among professional teams at various levels. At the elite level, game analysis becomes indispensable for match preparation because of the increased tactical competitiveness and the physical demands of players, where players are often required to cover more ground in games nowadays. With the aid of spatial technology, game analysis has shown tremendous value. At the FIFA World Cup 2010, the German national football team took advantage of the findings of the spatial analysis on their opponent, the English squad. The German goalkeeper Manuel Neuer made a long over-head goal-kick that penetrated the high English defence line. The lofted pass successfully found forward Miroslav Klose who then scored the 1-nil lead (1).
Before the positions of the balls and players were tracked by specific devices and wearables. Game analyses relied on footage of matches. Researchers were able to digitize players’ and the ball’s position from frames of images (2). By using template matching and Kalman filtering, players can be tracked. Using the center circle as the reference, researchers transformed images into a field model and determined the absolute positions. Besides the frame by frame position of the players, the trajectories show also the movement patterns of players and a group of players. This is valuable for analysts in the earlier day of soccer game analysis.

Credit: LFC Twitter
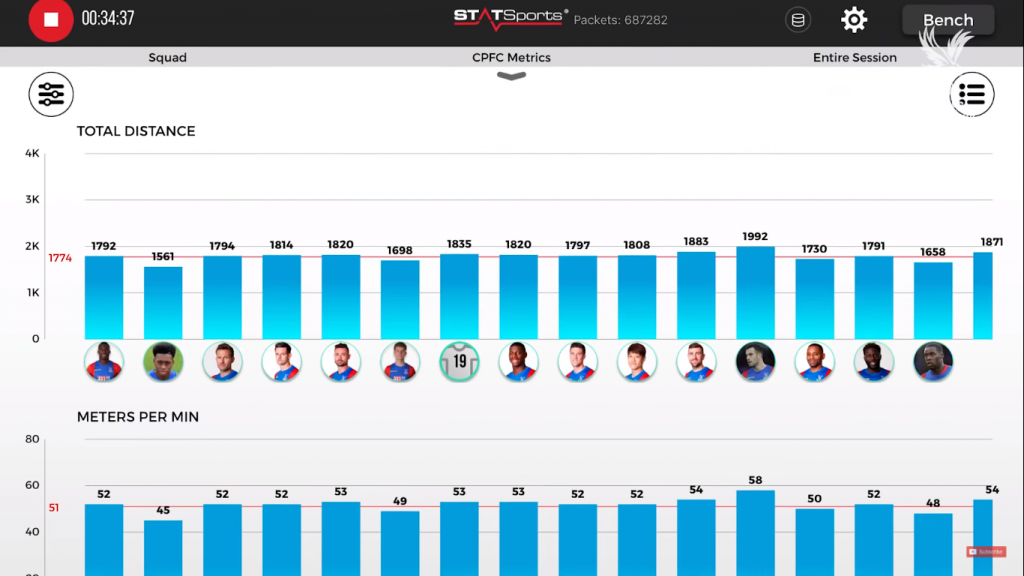
With the advancement of GPS technologies, the size of devices has shrunk and they have become more wearable by the players. With the high demand for performance, there are many options in GPS tracking and load management in the market. Products from companies like Catapult Sports, STATSports and GPSports not only track the players’ location but also include sensors that monitor the physiological performance of athletes. Information such as the distance covered by players, acceleration and speeding are immediately available to analysts and coaches. Many professional and national teams have started partnering with those providers and it is not difficult to spot athletes wearing tracking devices during training and match play.
Apart from the wearable tracking devices, which obviously are very important in collecting data and integrating spatial technology in sports, companies and academia have been putting efforts into the mathematics behind the scene. Kotzbek concluded that it is possible to prepare soccer-centric geo-data in a “GIS-appropriate” manner. He demonstrated how information from sports data providers can be imported in an ArcGIS environment. The field’s centre was located at the intersection point of the equator and the zero meridian line of Greenwich (3). The rest of the pitch, including sidelines, penalty areas were modelled relatively to the centre circle. Event features, such as points and lines, were created to represent different information, players as nodes, passing paths as lines. The graphics below showcased a modelled pitch in ArcMap (a), a series of tracked movements (b) and also event data such as the location where the ball has gone out of play (d).

Credit: Gilbert Kotzbek
With the increasing competitiveness of professional soccer, a new door has opened to cartographers and GIS specialists. It is beyond doubt that GIS technology has been and will be constantly applied in all kinds of sports, not only in soccer but also in basketball, American football, rugby.
Reference:
- Tactics Analysis in Soccer – An Advanced Approach by Andreas Grunz and Daniel Memmert
- Where are the ball and players? : Soccer Game Analysis with Color-based Tracking and Image Mosaick by Sunghoon Choi, Yongduek Seo, Hyunwoo Kim, Ki-Sang Hong
- Football Game Analysis: A New Application Area for Cartographers and GI-Scientists? by Gilbert Kotzbek and Wolfgang Kainz
Further Readings:


Be the first to comment