International Geospatial Digest November 20th, 2023
- Iceland’s Seismic Activity and Volcanic Forecast
- Overcoming Skills Gap in Aerial Surveying: A Recruitment Perspective
- Accelerating Iceberg Mapping: The AI Advancement
- Mapping the Future of Solar Energy: Introducing the New U.S. Large-Scale Photovoltaics Dataset
- The Reality of Ocean Destruction: A Detailed Mapping Analysis
- Protecting Your Property with First-Ever Flood Forecasting Maps
- The Future of Precise Global Weather Predictions using AI
Iceland’s Seismic Activity and Volcanic Forecast
Iceland is on the brink of a major volcanic eruption. According to the Icelandic Meteorological Office (MET), there is a “significantly high probability” of a volcanic eruption in the coming days. Thousands of residents in close proximity to the volcano have been evacuated from their homes. The website for the Met Office includes interactive maps and other tools that are tracking the country’s volcanic systems and vertical displacements.
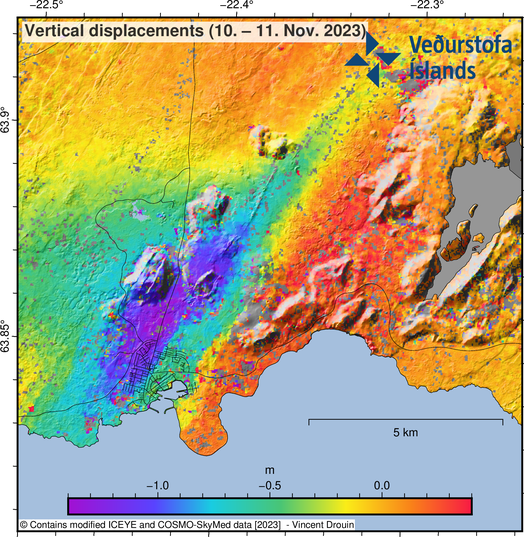 Source: Icelandic Met Office
The majority of Iceland, including the volcano, is situated between two tectonic plates, the movement of which causes seismic and volcanic activity. About 25 miles separate the volcano from Reykjavik, the capital of Iceland. Read more about this here.
Overcoming Skills Gap in Aerial Surveying: A Recruitment Perspective
Within the field of aerial surveying, knowledgeable experts are essential in gathering geospatial data from the air to support a variety of projects and endeavours. To comprehend aerial photography, sensor technology, and geospatial data, professionals in aerial surveying require a strong foundation in geomatics. Perhaps it should not be surprising that the business is having more and more difficulty finding, attracting, and retaining talent in light of these high demands—especially among geomatics professionals.
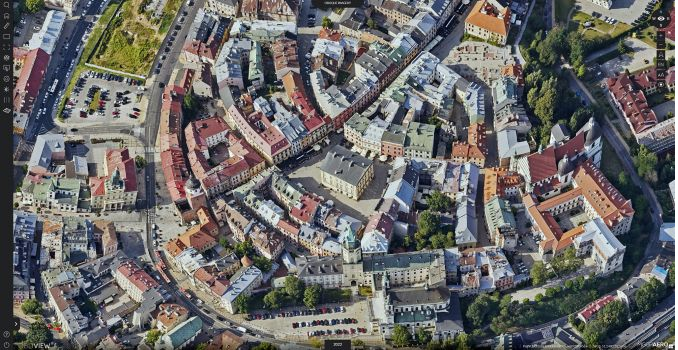
(Image courtesy: MGGP Aero)
Even though the first photogrammetric cameras were created a century ago, aerial mapping has not been exempt from the technical advancements that, over the past 20 years, have drastically changed the business. Recent advancements have increased the potential applications for aerial surveying. Read about key roles in surveying and more here
Accelerating Iceberg Mapping: The AI Advancement
A neural network developed at the University of Leeds has demonstrated the ability to quickly and precisely map the area covered by large Antarctic icebergs from satellite images; the network can complete this task in just 0.01 seconds. This new method is a far cry from the tedious and time-consuming manual labor that was previously required.
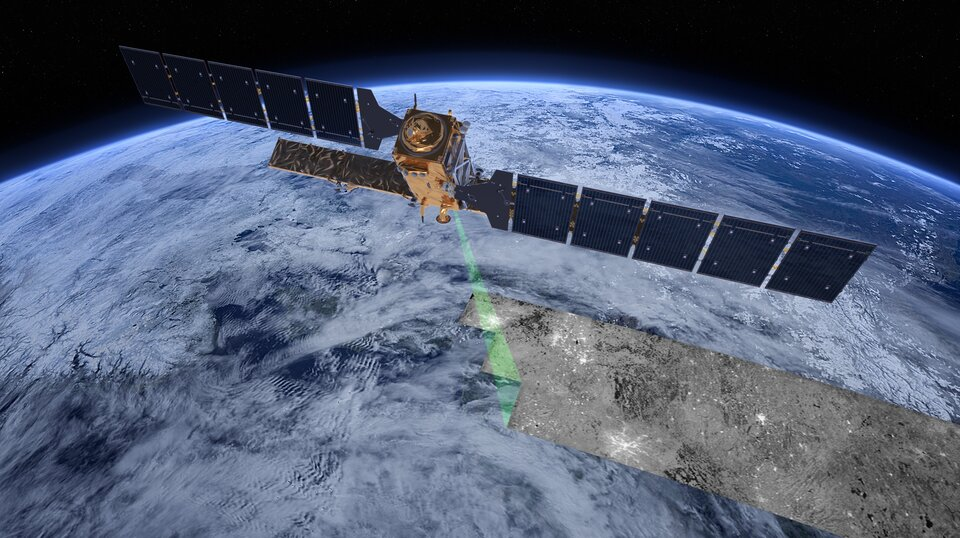
Sentinel-1’s radar vision
The neural network’s architecture is derived from the well-known U-net design. It was painstakingly trained with Sentinel-1 photos showing massive icebergs in different environments, using manually-derived outlines as the goal.
Unlike comparable approaches that often choose nearby slightly smaller icebergs, the neural network shown in this work is very good at detecting the largest iceberg in each image. Get more information here
Mapping the Future of Solar Energy: Introducing the New U.S. Large-Scale Photovoltaics Dataset
Berkeley Lab and USGS worked hand in hand to create the most comprehensive and in-depth large-scale solar facility database available to the public called United States Large-Scale Solar Photovoltaic Database (USPVDB) The locations along with its features of ground-mounted large-scale solar (LSS) photovoltaic energy facilities in the US are listed in ample detail in the USPVDB, an advanced dataset.
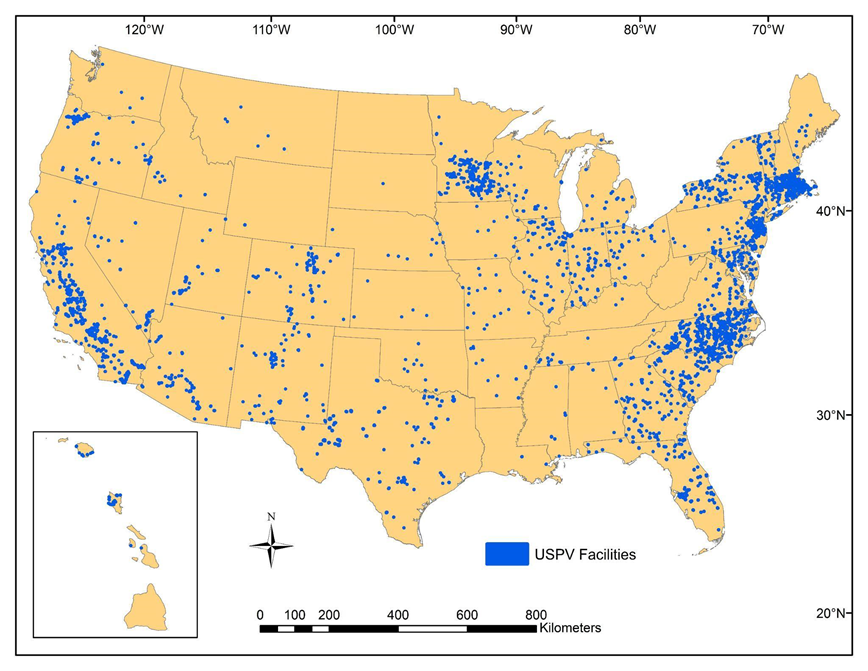
Locations of USPVDB facilities
Comprehensive facility attributes such as array area size, panel technology type, axis type, installation year, and rated electricity production capacity are all included in the USPVDB database. The good news is that USPVDB datasets are publicly available for use in research, policy analysis, decision-making, and general exploration. Read more on this here
The Reality of Ocean Destruction: A Detailed Mapping Analysis
In their new report 30×30: From Global Ocean Treaty to Protection at Sea, Greenpeace International draws attention to the fact that apparent yearly fishing activity in the High Seas increased by 8.5% to almost 8.5 million hours between 2018 and 2022.
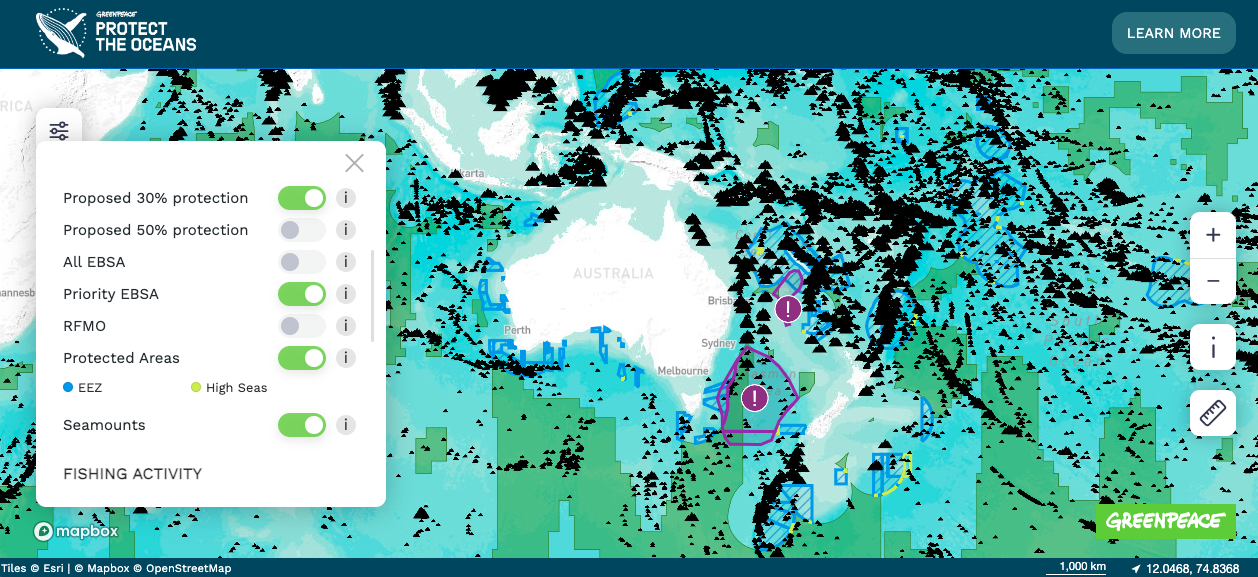
In this view the map shows seamounts in black and the proposed marine protected areas in purple. Have a look at the interactive map to find out more.
Our 30X30 Protect the Oceans interactive map makes this daunting mental image come to life with just a few clicks. It could appear that the terrible reality of ocean degradation is the only thing this map depicts. However, it also offers us hope by illuminating what 30% and 50% ocean protection might entail. Read in detail here
Protecting Your Property with First-Ever Flood Forecasting Maps
The first flood forecasting system with accurate, real-time data indicating areas at immediate risk of flooding has been launched by the National Weather Service.
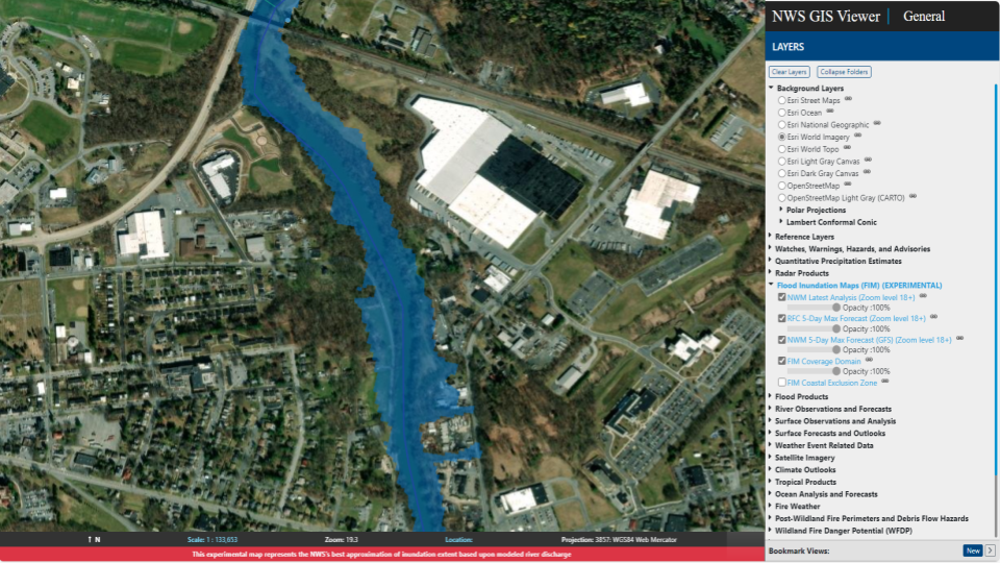
NWS’s new experimental flood inundation maps help communicate the timing and magnitude of high water events by showing modeled inundated areas in blue overlay. Emergency managers may use these services to preposition resources, secure critical infrastructure and recommend evacuations and evacuation routes. Credit: NOAA
By shading the areas blue on an online map, the National Weather Service venture provides the first real-time forecasting service that indicates precise locations, such as city blocks, likely to experience at least an inch of flooding over the next five days. Read more about this new flood forecasting map.
The Future of Precise Global Weather Predictions using AI
GraphCast, is a cutting-edge AI model with previously unheard-of accuracy for medium-range weather forecasts. Compared to the industry standard weather simulation system, the High Resolution Forecast (HRES) generated by the European Centre for Medium-Range Weather Forecasts (ECMWF), GraphCast forecasts weather conditions up to 10 days ahead of time with much greater accuracy and speed.
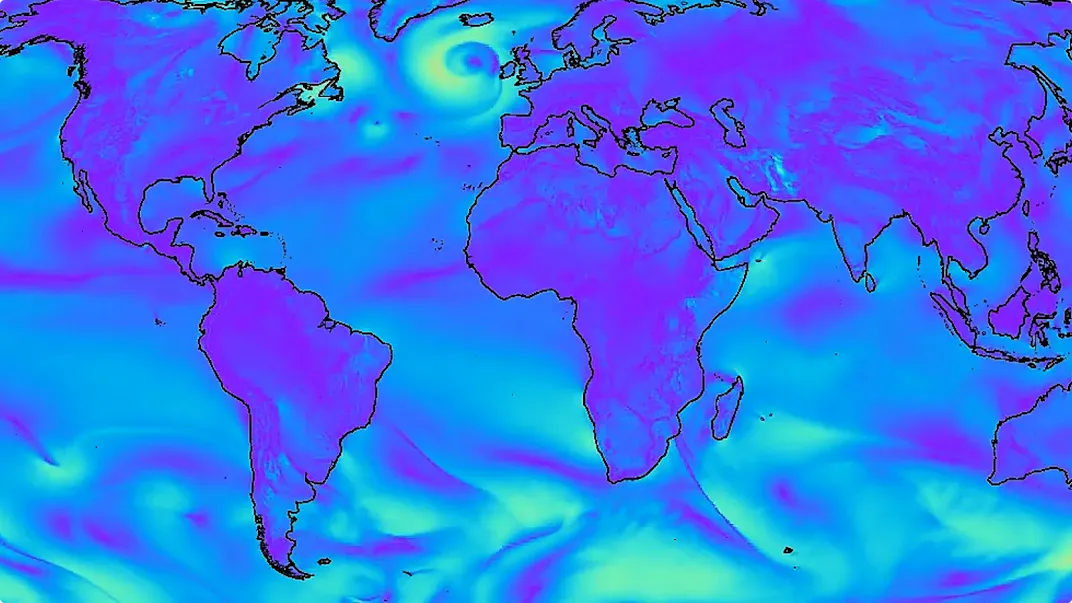
Source: Google Deep Mind
A machine learning and Graph Neural Network (GNN) based weather forecasting system, GraphCast is an especially helpful architecture for handling spatially structured data. At the equator, GraphCast forecasts with a high resolution of 0.25 degrees longitude/latitude, or 28 km x 28 km. Over a million grid points, or the whole surface of the Earth, are covered by that. The model predicts six atmospheric variables at each of the 37 levels of altitude, including specific humidity, wind speed and direction, and temperature, and five Earth-surface variables at each grid point, including temperature, mean sea-level pressure, and wind speed and direction. Read more here.


