Mapping the Deep: Our map of the ocean remains a work in progress
These days, when you look at Google Maps, Google Earth, or other web maps you are probably left with the impression that most of the world’s ocean is well mapped. You can see large mid-ocean ridges, basins, seamounts, trenches and more. The ocean is massive, so it seems that with all we have captured, we have done a very good job. However, surprisingly, as of mid-2023 only about 25% of the seafloor was mapped, a tremendous improvement from only 5% in 2016.
If you are anything like me, you are thinking, “How could this be? I have used Google Earth and I have followed trenches, explored the terrain, and traced the lines that paint a stunning and seemingly detailed picture of the ocean. But, if you pull back the veil on the unmapped areas of the seafloor, you will see that most of it remains uncharted. This article will discuss what efforts are being made to right the ship on seafloor mapping.
A (Brief) History of Ocean Mapping
Since the early days of European exploration and sailing the ocean blue we have been building our modern collection of ocean maps. It began with a frenzy of mapping ‘undiscovered’ coastlines and returning home with that knowledge to add to the explorers’ respective countries’ ever-expanding maps of the ‘new world.’ These new maps were highly guarded secrets, with many of the colonial powers eager to have the best and most up-to-date maps to gain a leg up on their competition. In Spain, the king declared “that all pilots and mates aboard Spanish ships must be Spanish,” while in Portugal, the revealing of these navigational secrets was punishable by death. However, almost all of these mapping efforts were solely concerned with mapping coastlines and surface waters – and while some technologically limited attempts were made to measure the depths of the ocean by these explorers – it was not until the early 20th century that mapping the deep truly got its start.
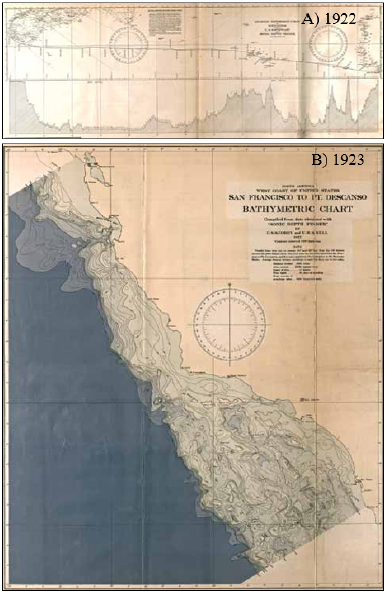
The invention of sonar around 1918 was a breakthrough in ocean mapping capabilities, and while its first uses included tracking icebergs and submarines, as soon as the 1920s, the NOAA precursor Coast and Geodetic Survey used sonar to conduct measurements of deep water areas. But early sonar was single-beam, and while it provided a much greater understanding of the ocean floor than ever before, it was still an onerous undertaking and most surveys were conducted close to land (Map B below) or in single passes along ocean basins (Map A below).
In fact, it was several decades until the next big break in ocean mapping occurred. Due to heightened tensions between the USA and USSR in the early cold-war period, technical advancement in subsurface detection was critical to be informed on the movement of the adversaries’ subsurface fleet. This led to the development of the first multibeam echosounders (sonar) in the 1960s. A great analogy for how much better multibeam sonar is compared to single beam is this: Imagine tracing an object with one finger in an attempt to understand what that object is (single-beam) vs. tracing the same object with your whole hand (multi-beam), and you can quickly understand the added depth and detail multibeam provides.
Haven’t we mapped the oceans?
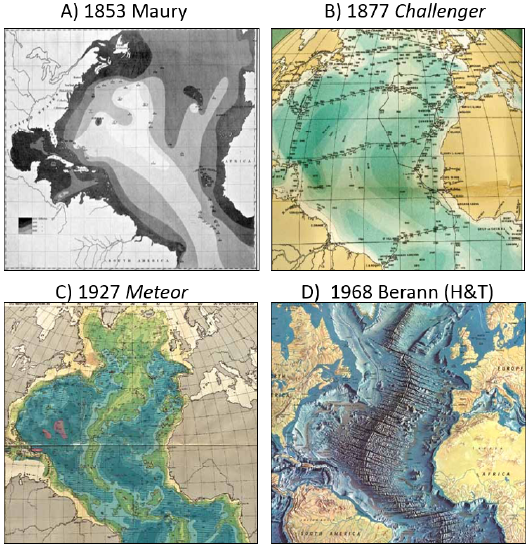
Looking at the figure above we can see that serious progress appears to have been made in the 100 or so years between the first and last image. However, it is partly due to the overwhelming success of the final map (D), and its influence, that we are in this position. Unable to set out to sea and collect data herself due to the archaic practices of the time, Marie Tharp was an oceanographic cartographer without a boat until she found a willing partner in Bruce Heezen. Their collaboration led to the creation of some of the most famous ocean maps of all time. Heezen would traverse the oceans collecting data in his position at Columbia University while Tharp would pour over the data and create profiles that allowed for the creation of a never-before-seen map of the ocean floor.
By plotting the bathymetric data, Tharp and Heezen were able to create maps of ocean basins with unprecedented detail, mapping ridges and trenches and conveying the bottom of the ocean for the public. Their work was instrumental in advancing the fledgling scientific theory of continental drift and, through a partnership with artist Heinrich Berran, they created some absolutely stunning physiographic maps that captured the public’s attention.
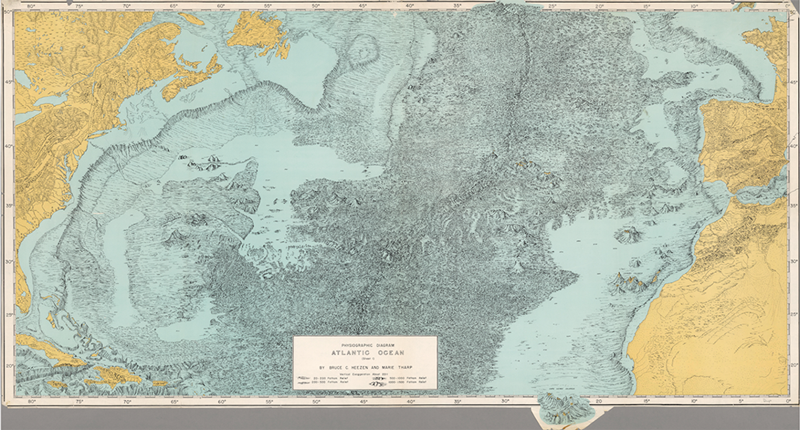

While these artistically driven physiographic maps helped capture the public’s imagination and brought attention to the drastic topography of the ocean floor, there were two problems created by the phenomenon. The first was that, as we have later found out, the data and maps were not that accurate overall. Working within the limitations of the technology and funding available, the maps were certainly an achievement, but further research has shown that many coordinates of the features depicted, such as seamounts and trenches, were wildly inaccurate or downright impossible to locate. The second issue was that these highly detailed, but unfortunately inaccurate, maps gave the public the general impression that we had conquered the seafloor, and mapped it in great detail. This isn’t to take away from the monumental oceanographic bathymetry breakthroughs that Tharp and Heezen made, but just to highlight that the long fight to map the seafloor is far from over. The 60s were also the culmination of the space race with the Apollo manned lunar missions capturing the public spotlight and therefore drawing away precious scientific exploration dollars.
With more focus on space exploration and less on the ocean floor, seabed mapping took a backseat for much of the second half of the 20th century. However, these efforts in space exploration would contribute more to ocean science than one would think. The rapid development of satellites for earth observation changed our relationship and understanding of the natural systems of our planet profoundly. In doing so, we gained access to new data and insights that give us the data to make extremely detailed observations of events and patterns.
One of these patterns is global mean sea level, which is a measurement of global sea levels derived from reflected radar pulses sent down by orbiting satellites. As we have been observing sea level from space since 1993, we have developed an understanding of how to read these measurements to get a generalised topography of the seafloor. The Earth’s gravitational pull on the ocean can be used to derive bathymetry from observing tilts in the sea surface to infer seafloor topography, such as sea mounts or trenches, as seen in the figure below.

With the sheer quantity of observations made by satellites over the past 30+ years, we have gathered enough information to have (what looks like) an incredibly detailed ocean bathymetry map. However, it remains lacking and wanting for serious navigation or defense requirements in many coastal environments, and therefore, is not a good enough solution. In fact, some satellite derived bathymetry features have proven to not exist or not be accurate, which tells us that we still don’t understand many earth processes as well as we think. This could be surprising if you take a look at the map below, but there is hope on the horizon.

How do we get better at mapping the ocean?
While there have been misunderstandings through time about the completeness of our ocean mapping efforts, the good news is that we are still working hard towards this lofty goal. Seabed 2030 is a project orchestrated by the Nippon Foundation and GEBCO that aims to create a “definitive map of the world ocean floor by 2030 and make it available to all.” Efforts to move the dial on seafloor mapping have been progressing in recent years largely thanks to Seabed 2030 and its efforts. Earlier this year on World Hydrography Day Seabed 2030 announced that 26.1% of the world’s seafloor has been mapped.
While this progress is promising, it does not appear to be enough to reach this goal of 100% by 2030. Not without help, at least. That is why the organization and others are looking to governments and militaries to help fill in the gaps and increase the likelihood of reaching the goal. There is a call for these organizations to release long-withheld information and data in an effort to achieve some global coordination and transparency in mapping the seafloor. While some governments and their respective militaries have reasonable grounds to cite national defense concerns when it comes to these secretive seafloor maps, open data proponents are hoping that they could be met somewhere in the middle, asking for the release of data obtained in less sensitive areas. This would go a long way to filling in many of the gaps facing Seabed 2030, and many (but not all) think that this is truly the only way to achieve this goal.
Due to the lack of response from some governments in this effort to aid ocean mapping with secured data, some are looking to break the mold, and contribute to seafloor mapping with new, alternative methods. The cost to run an oceanic survey ship is gigantic, and a significant portion of that cost comes from having to feed, house, and assure the general comfort of what can be rather large crews. Some startups are looking to reduce this cost drastically with the introduction of autonomous ocean mapping vessels into the exploration game.
Saildrone is an American company with a fleet of autonomous vessels including one class for shallower-continental-shelf mapping and a larger class designed for deep-sea mapping up to depths of 11,000 metres. They have delivered promising results and high-quality data from recent missions to the Aleutian Islands, around California, and even discovered a new shipwreck in the Gulf of Mexico on their first multi-beam shallow water voyage.
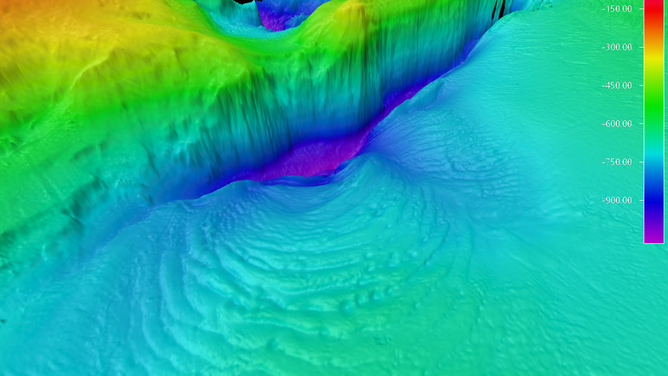
Bedrock Ocean Exploration is a Public Benefit Corporation based in the US that uses AUVs (autonomous underwater vehicles) for seafloor mapping. They are “committed to providing the world with a free, publicly available map of our world’s oceans, 50x more detailed than the current best public map available.” As a partner of Seabed 2030, they are invested in publicly accessible, high-resolution seafloor maps and working hard to achieve this goal. Their fleet is capable of autonomous hydrographic surveys, geophysical surveys, as well as the identification of unexploded ordinances.
How Big is the Ocean?
Further Reading
[1] https://www.livescience.com/planet-earth/rivers-oceans/what-percentage-of-the-ocean-have-we-mapped
[2] Trethewey, L. (2023). The deepest map: The high-stakes race to chart the world’s oceans. Goose Lane Editions.
[3] https://oceanexplorer.noaa.gov/explorations/02fire/background/seafloor_mapping/seafloor.html
[4] Dierssen, Heidi & Theberge, Albert. (2020). Bathymetry: Seafloor Mapping History. 10.1201/9780429441004-21.
[5] https://dosits.org/galleries/technology-gallery/observing-the-sea-floor/multibeam-echosounder/
[6] https://storymaps.arcgis.com/stories/232257acdac6409a907abd77b3d83f89
[7] https://sealevel.nasa.gov/understanding-sea-level/key-indicators/global-mean-sea-level/
[8] https://www.star.nesdis.noaa.gov/socd/lsa/AltBathy/
[9] https://seabed2030.org/
[10] https://www.gebco.net/
[11] https://www.foxweather.com/earth-space/exploring-unknown-drone-mapping-uncharted-ocean-alaska-california

